What is your Nextcloud Web UI speed?

I would like to find out what is “normal” (by design or by requirement) speed of Nextcloud web UI.

What I am looking for is how quickly is the web UI ready after “clicking” on the “Files” app (https://YOURSERVER/apps/files/).

My times are between 4-5 seconds in best case (previously one times loaded to eliminate the network transport overhead). Means already logged in and the “Files” app has been at least one clicked in the same session.

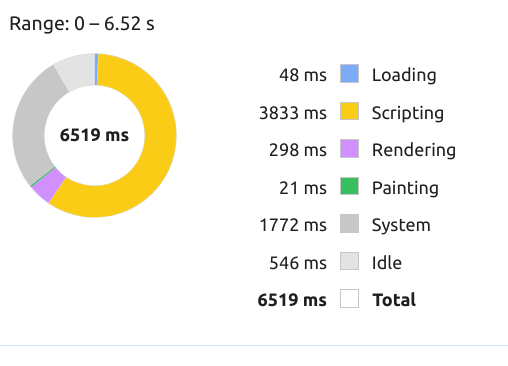
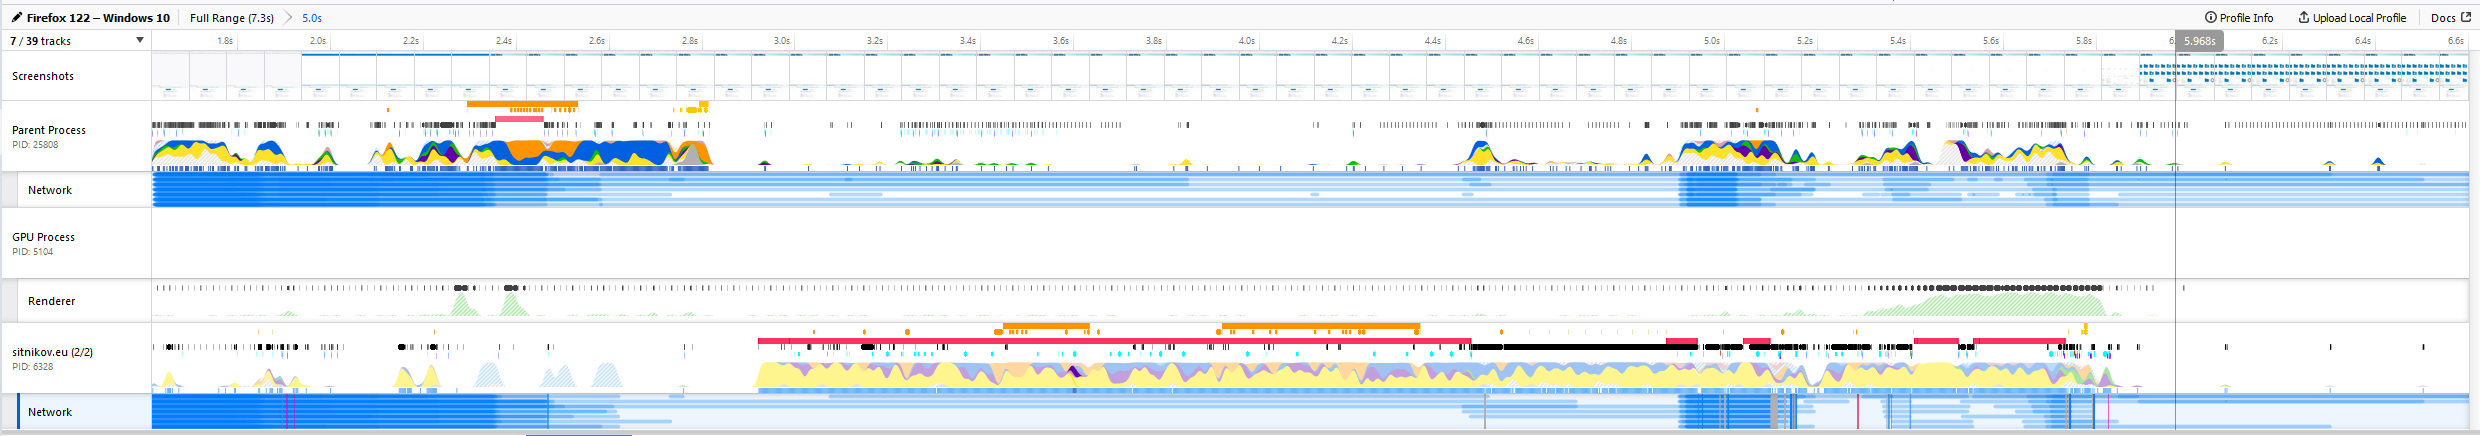
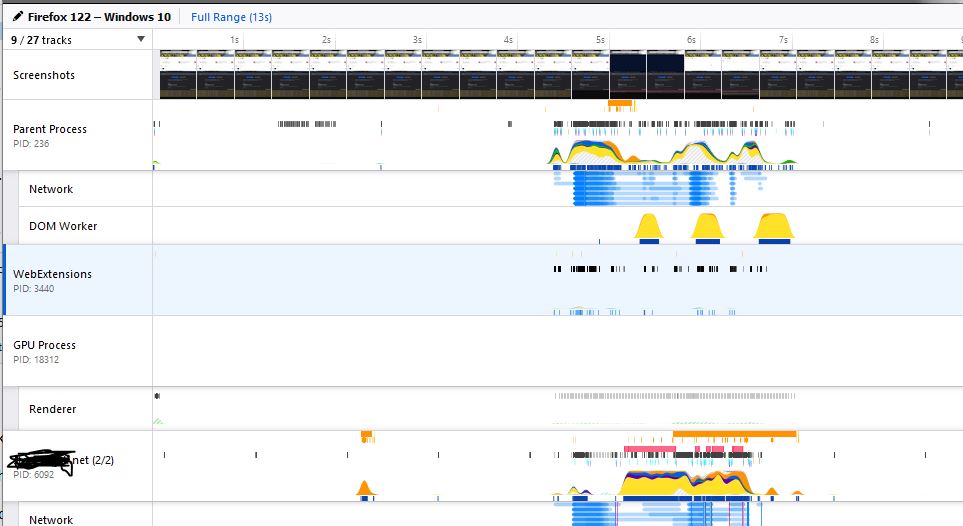
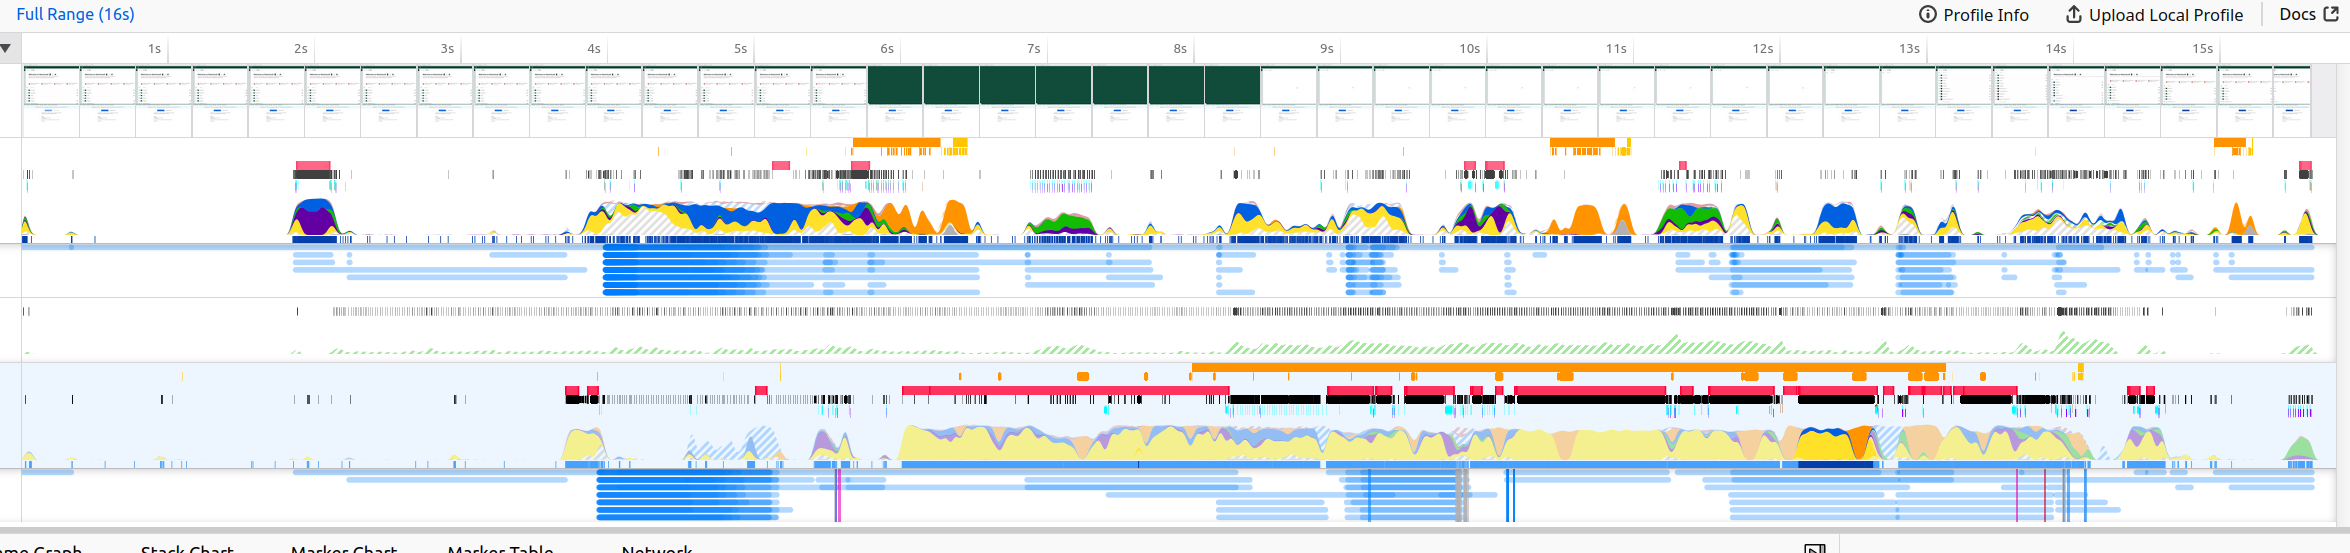
Most of the time is spent in “scripting” when profiled by Chrome profiler.

When compared with the Goolgle alternatives it is pretty and annoyingly slow.

Would you be so kind and share your times along with your version?

My average time is 4-5 secs, version 27.1.5, no extra apps.

1 Like

When upgrading to NC version 28.0.2 you will notice improvement.
The Files App in version 28.0.2 has been rewritten, thereby migrating to Vue.js, a popular, modern web toolkit packed with possibilities. This brings a number of performance benefits you’ll appreciate: The code is more modular, requiring less javascript to be loaded.

You can also look in the documentation to tune your NC instance:
https://docs.nextcloud.com/server/stable/admin_manual/installation/server_tuning.html

How is your Nextcloud instance installed, hosted by a provider or self hosted?
What php version does your server use?

3 Likes

If self-hosted, look into bumping the PHP cache. That did wonders for performance here.

1 Like

On Firefox the files tab, with cache disabled in the browser loads in 5.99 s. With the browser cache enabled it loads in 1.84 s

General Setup
Nextcloud: 28.0.2
Install method: Debian fpm community docker container
Storage: NVME
Database: Postgres 15
memcache.local: APCu
memcache.distributed: Redis

Note: I’m using unix sockets for the DB and Redis communication

Php tweaks:

apc.enable_cli=1
upload_max_filesize=1G
post_max_size=1G
memory_limit=512M
opcache.enable=1
opcache.revalidate_freq=10
opcache.validate_timestamps=1
opcache.max_accelerated_files=19469
opcache.memory_consumption=256M
opcache.interned_strings_buffer=16
opcache.jit_buffer_size=128M
opcache.jit=1255
opcache.fast_shutdown=1
opcache.save_comments=1
pm = dynamic
pm.max_children = 480
pm.max_requests = 250
pm.start_servers = 60
pm.min_spare_servers = 30
pm.max_spare_servers = 60
1 Like

Hello,

Sefhosted / Snap Version with U22 LTS

My times are exactly same as yours, around 4/5 seconds in average in Edge. However, unless it generating some image preview, navigation within file app is somewhat instant !!

Update :- BTW, if I have dev tools on (f12) for actual measurement, it is taking that longer 4/5 seconds, but without that devtools on, edge is loading the files up way quicker, like for manual calculation, it is like a second or two max…

Thanks

1 Like

Today I upgraded to 28.0.2 and it is still slow

Without profiler:

With profiler:
(please note that the 6.5s is selected range the total time is about 5.9s)
image

My instance is self hosted.

It runs on Ubuntu 22.04 (i7, 16GB ram, SSD drive).

nginx version: nginx/1.18.0 (Ubuntu)
PHP 8.1.2-1ubuntu2.14
Redis server v=6.0.16
mariadbd Ver 10.6.16-MariaDB-0ubuntu0.22.04.1

Network is wired, server<=>switch<=>client.

.

@vbspam
Maybe there is no caching in your browser. Can you post more details? Please use browser dev tools (F12) and then network analysis.

I woud definitely look into cacheing
Details form the admin manual:

Recommendations based on type of deployment

You may use both a local and a distributed cache. Recommended caches are APCu and Redis. After installing and enabling your chosen memcache (data cache), verify that it is active by running PHP version and information.

Note

See specific cache configuration options under the appropriate section further down.

Small/Private home server

Only use APCu:

‘memcache.local’ => ‘\OC\Memcache\APCu’,

Organizations with single-server

Use Redis for everything except local memcache:

‘memcache.local’ => ‘\OC\Memcache\APCu’,
‘memcache.distributed’ => ‘\OC\Memcache\Redis’,
‘memcache.locking’ => ‘\OC\Memcache\Redis’,
‘redis’ => [ ‘host’ => ‘localhost’, ‘port’ => 6379, ],

But please follow the instruction in teh admin manual:
https://docs.nextcloud.com/server/latest/admin_manual/configuration_server/caching_configuration.html

Please let us know your findings. Good Luck!

Relevant fragments of config.php, I have it like that for ages:

‘dbtype’ => ‘mysql’,
‘version’ => ‘28.0.2.5’,
‘dbname’ => ‘nextcloud’,
‘dbhost’ => ‘localhost’,
‘dbport’ => ‘’,
‘dbtableprefix’ => ‘oc_’,
‘mysql.utf8mb4’ => true,
‘installed’ => true,
‘memcache.local’ => ‘\OC\Memcache\APCu’,
‘memcache.distributed’ => ‘\OC\Memcache\Redis’,
‘memcache.locking’ => ‘\OC\Memcache\Redis’,
‘updater.release.channel’ => ‘stable’,
‘maintenance’ => false,
‘theme’ => ‘’,
‘maintenance_window_start’ => 1,

I am not expert in NC, but the Chrome profiler shows very little network overhead.

So I would suspect the frontend being slow specially if it shows significant times in the “Scripting” phases. Does anyone know how to interpret the times for NC? I am asking because long times in scripting could be caused by waiting for server.

The cache is not disabled in the browser. Look at the “Loading” phase and transferred data (30 kB).

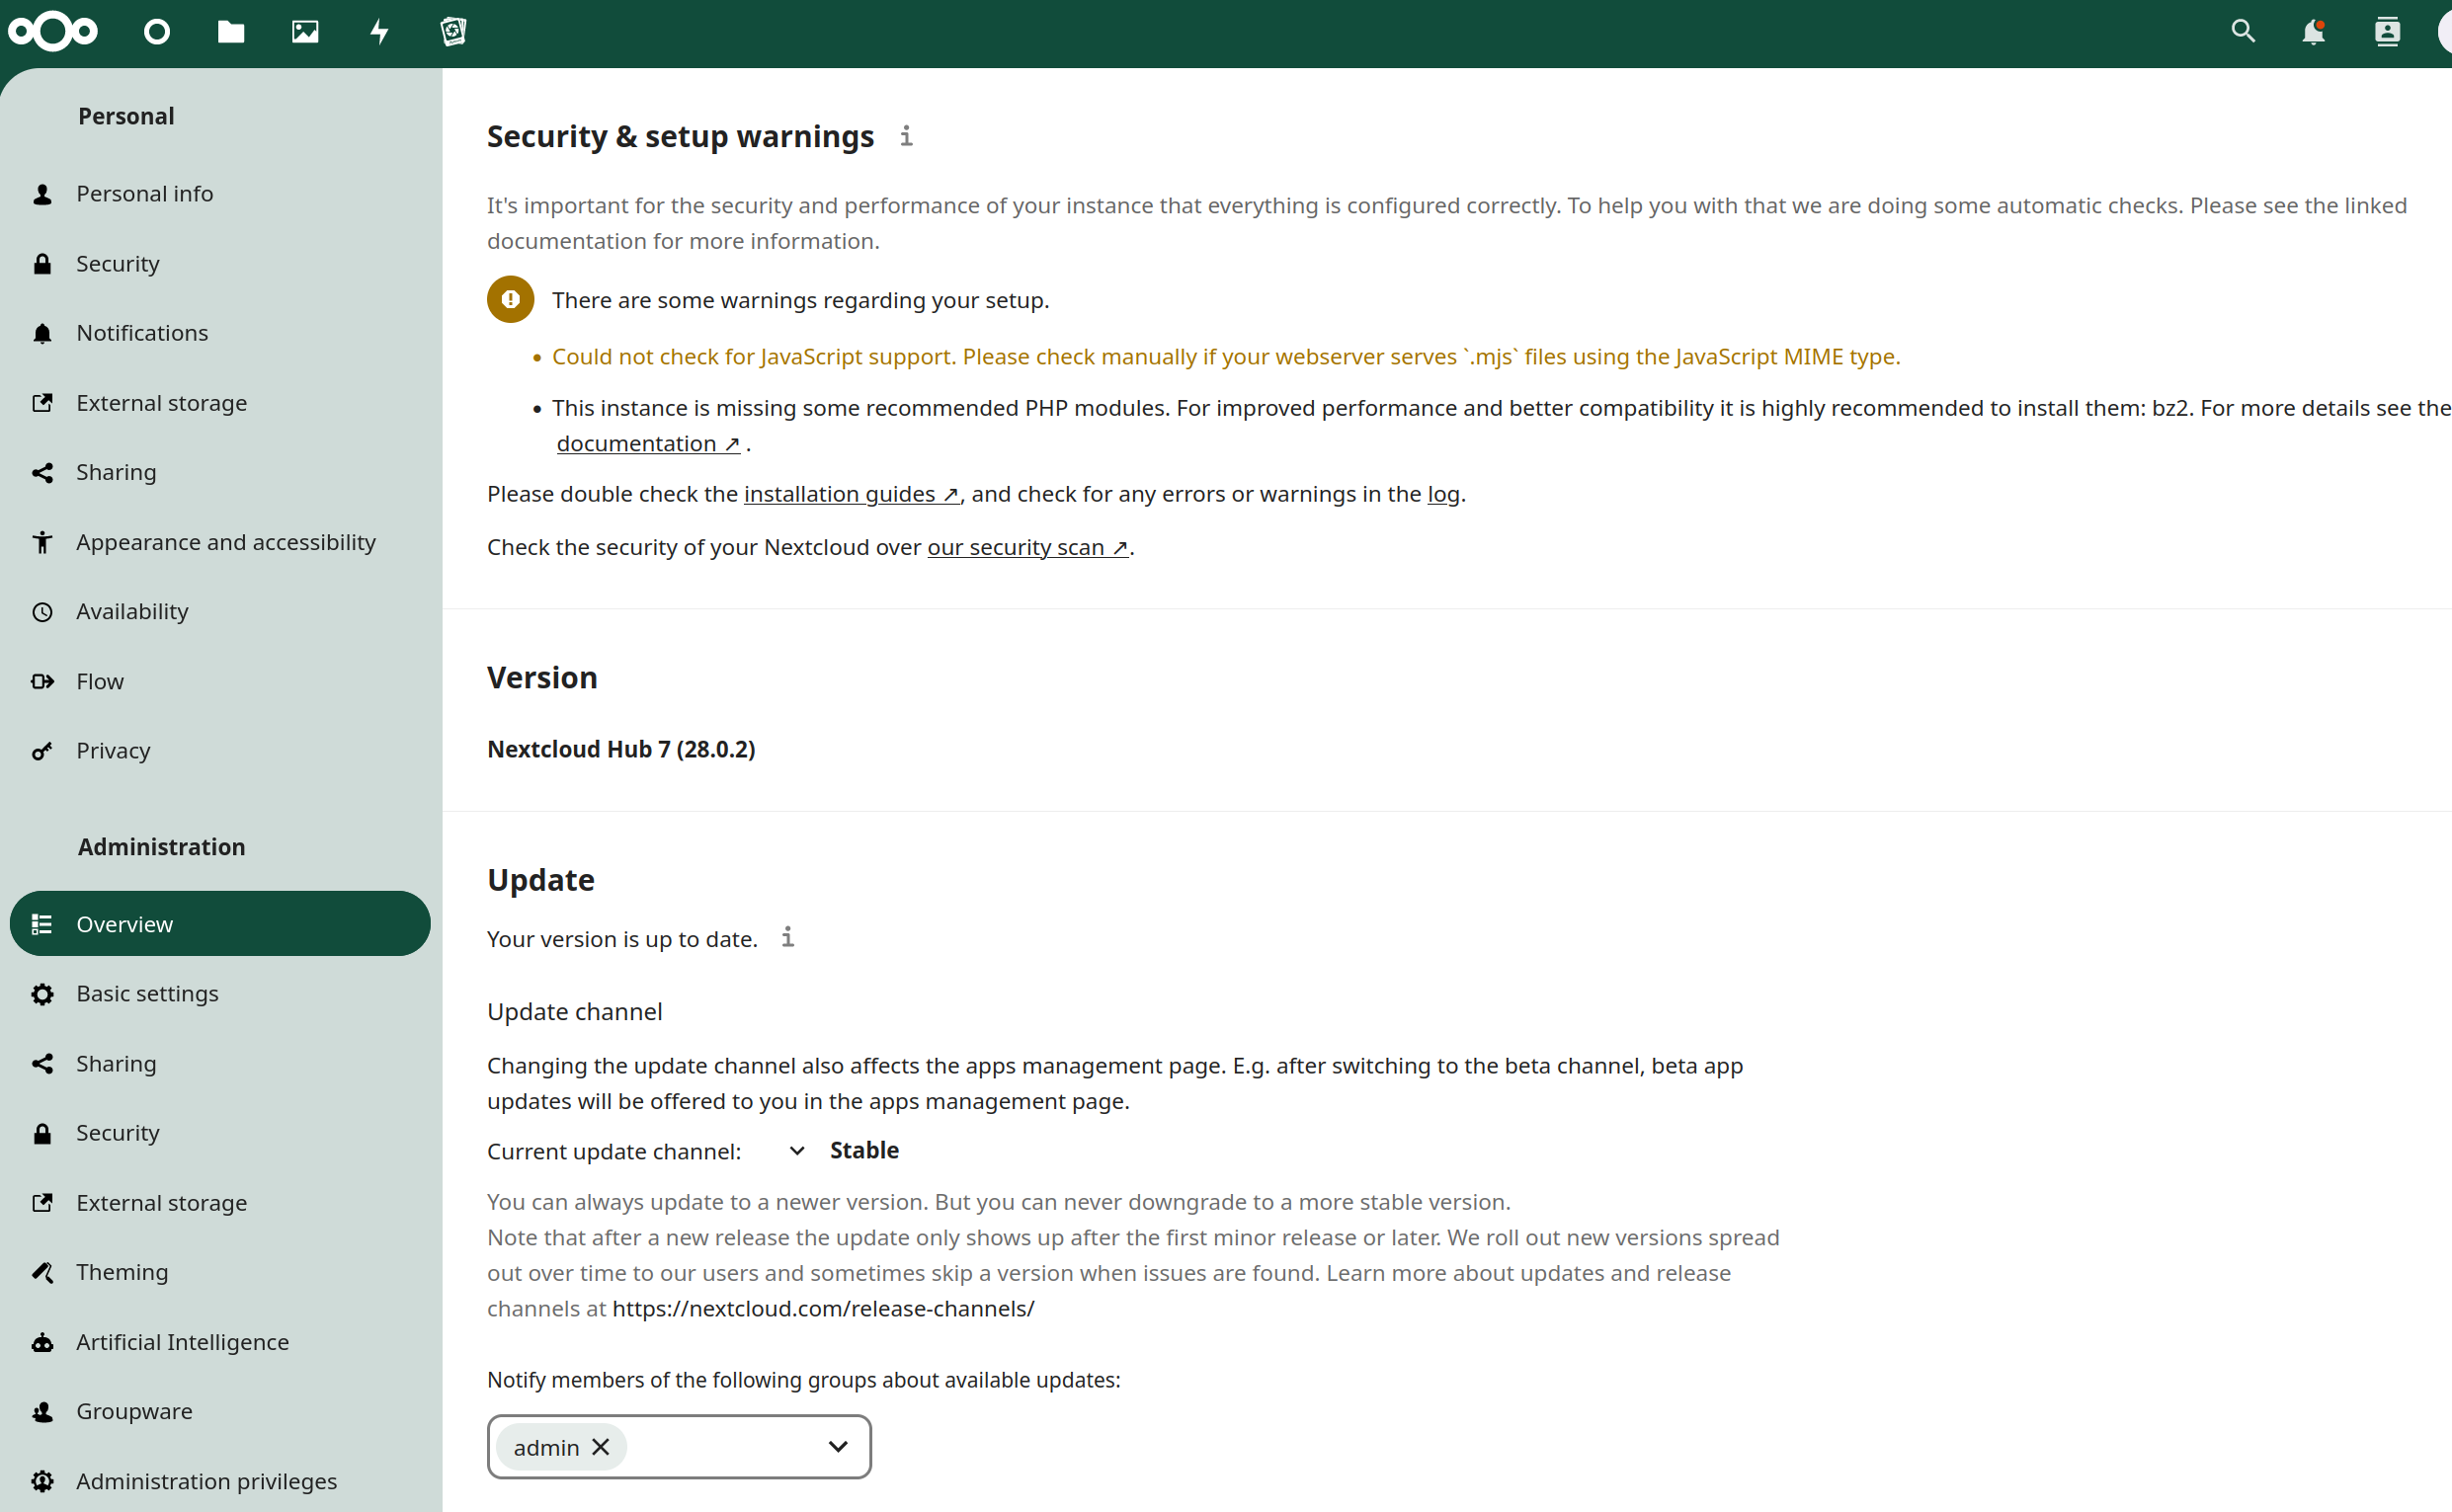
Apologies if I missed something above, but do you see any setup warnings when you go to Administration Settings > Overview?
My UI load times in the browser are only about 2 seconds. Pretty snappy, I’d say, considering I’m self hosted on DIY hardware (nothing fancy). My NC server runs as a VM under Fedora with 3 other active VMs, so just comparatively speaking I’d say you can surely tune your NC to be much faster than it is currently. :slight_smile:

1 Like

Around 4,7 seconds.

1 Like

These two warnings came after recent upgrade. It was slow before and it is still now.

1 Like

I would like to ask you for a favor. Would you be so kind and record your server load times in Chrome?

If you would consider it, here is how to reproduce the test:

  1. Go to https://YOURSERVER/apps/files/ just to fill the cache
  2. Go to “Inspect” => Network and make sure the “Disable cache” is unchecked
  3. Go to “Inspect” => Performance and press Ctrl+Shift+E and keep recording until the page fully reloads (shall not take more than 10secs)
  4. The please share the pie chart (same I shared above)

I don’t have Chrome but here’s an output from Firefox. I haven’t done this before but I think this is the output you needed. Hope this helps.

This is mine from FF

One question:
You have compression enables on your server?

Recommendation (if not taken care of yet):
Please install all required PHP modules.

Organizations with single-server

  1. Did you specify the host and port details for Reis in your nextcloud config file?
  2. What is the status of Redis server (enabled and running)?

From the admin manual:

Use Redis for everything except local memcache:

‘memcache.local’ => ‘\OC\Memcache\APCu’, ‘memcache.distributed’ => ‘\OC\Memcache\Redis’, ‘memcache.locking’ => ‘\OC\Memcache\Redis’, ‘redis’ => [ ‘host’ => ‘localhost’, ‘port’ => 6379, ],

reference:
https://docs.nextcloud.com/server/latest/admin_manual/configuration_server/caching_configuration.html