3º - in docker server with super user: sudo su (5.4.0-107-generic #121-Ubuntu SMP Thu Mar 24 GNU/Linux) .
4º - git clone https://github.com/theCalcaholic/ncp-monitoring-dashboard
5º- cd ncp-monitoring-dashboard
6º- nano .env “Configure the variables in .env”
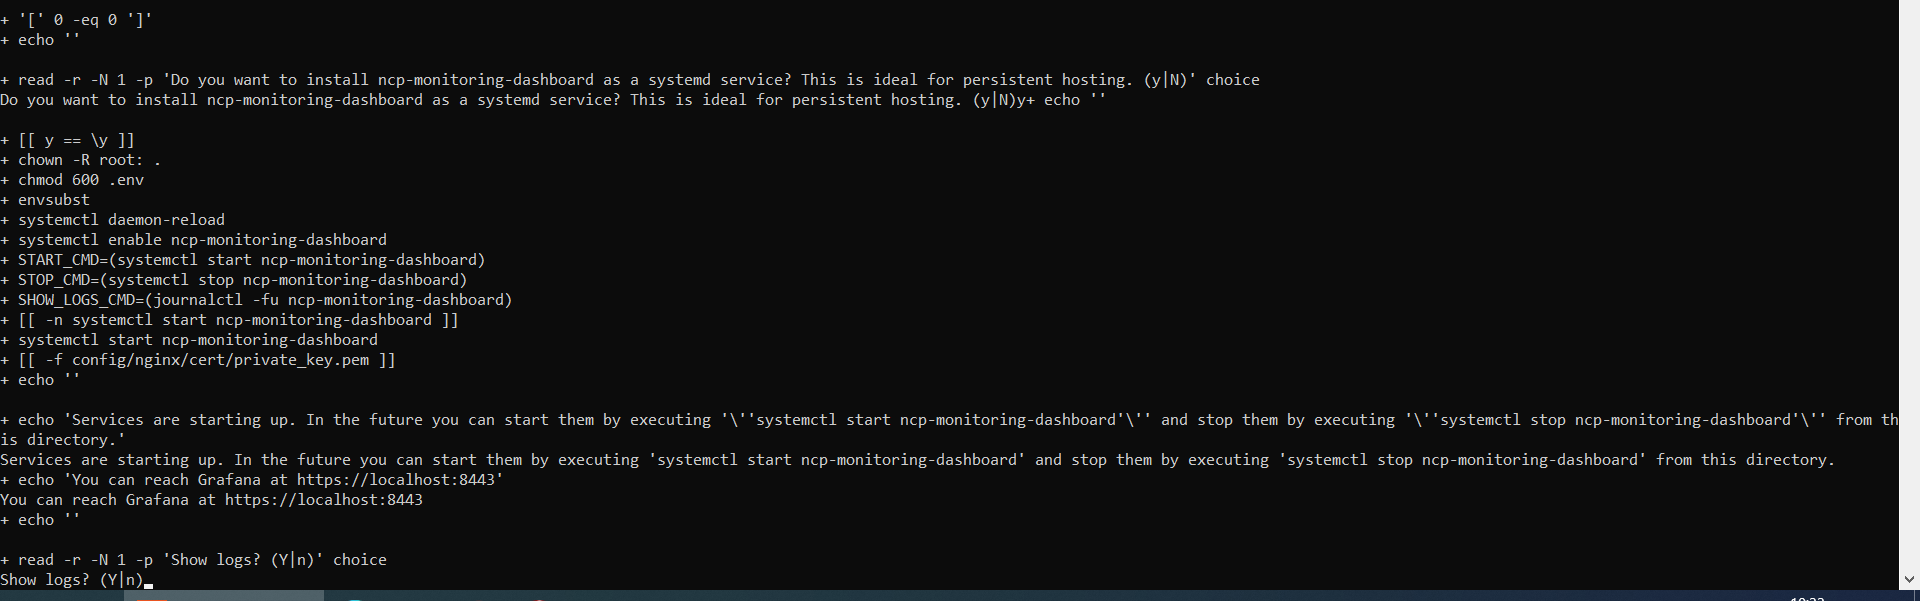
7º- ./start.sh
The ./start.sh log is somewhat confusing
+ '[' 0 -eq 0 ']'
+ echo ''
+ read -r -N 1 -p 'Do you want to install ncp-monitoring-dashboard as a systemd service? This is ideal for persistent hosting. (y|N)' choice
Do you want to install ncp-monitoring-dashboard as a systemd service? This is ideal for persistent hosting. (y|N)y+ echo ''
+ [[ y == \y ]]
+ chown -R root: .
+ chmod 600 .env
+ envsubst
+ systemctl daemon-reload
+ systemctl enable ncp-monitoring-dashboard
+ START_CMD=(systemctl start ncp-monitoring-dashboard)
+ STOP_CMD=(systemctl stop ncp-monitoring-dashboard)
+ SHOW_LOGS_CMD=(journalctl -fu ncp-monitoring-dashboard)
+ [[ -n systemctl start ncp-monitoring-dashboard ]]
+ systemctl start ncp-monitoring-dashboard
+ [[ -f config/nginx/cert/private_key.pem ]]
+ echo ''
+ echo 'Services are starting up. In the future you can start them by executing '\''systemctl start ncp-monitoring-dashboard'\'' and stop them by executing '\''systemctl stop ncp-monitoring-dashboard'\'' from this directory.'
Services are starting up. In the future you can start them by executing 'systemctl start ncp-monitoring-dashboard' and stop them by executing 'systemctl stop ncp-monitoring-dashboard' from this directory.
+ echo 'You can reach Grafana at https://localhost:8443'
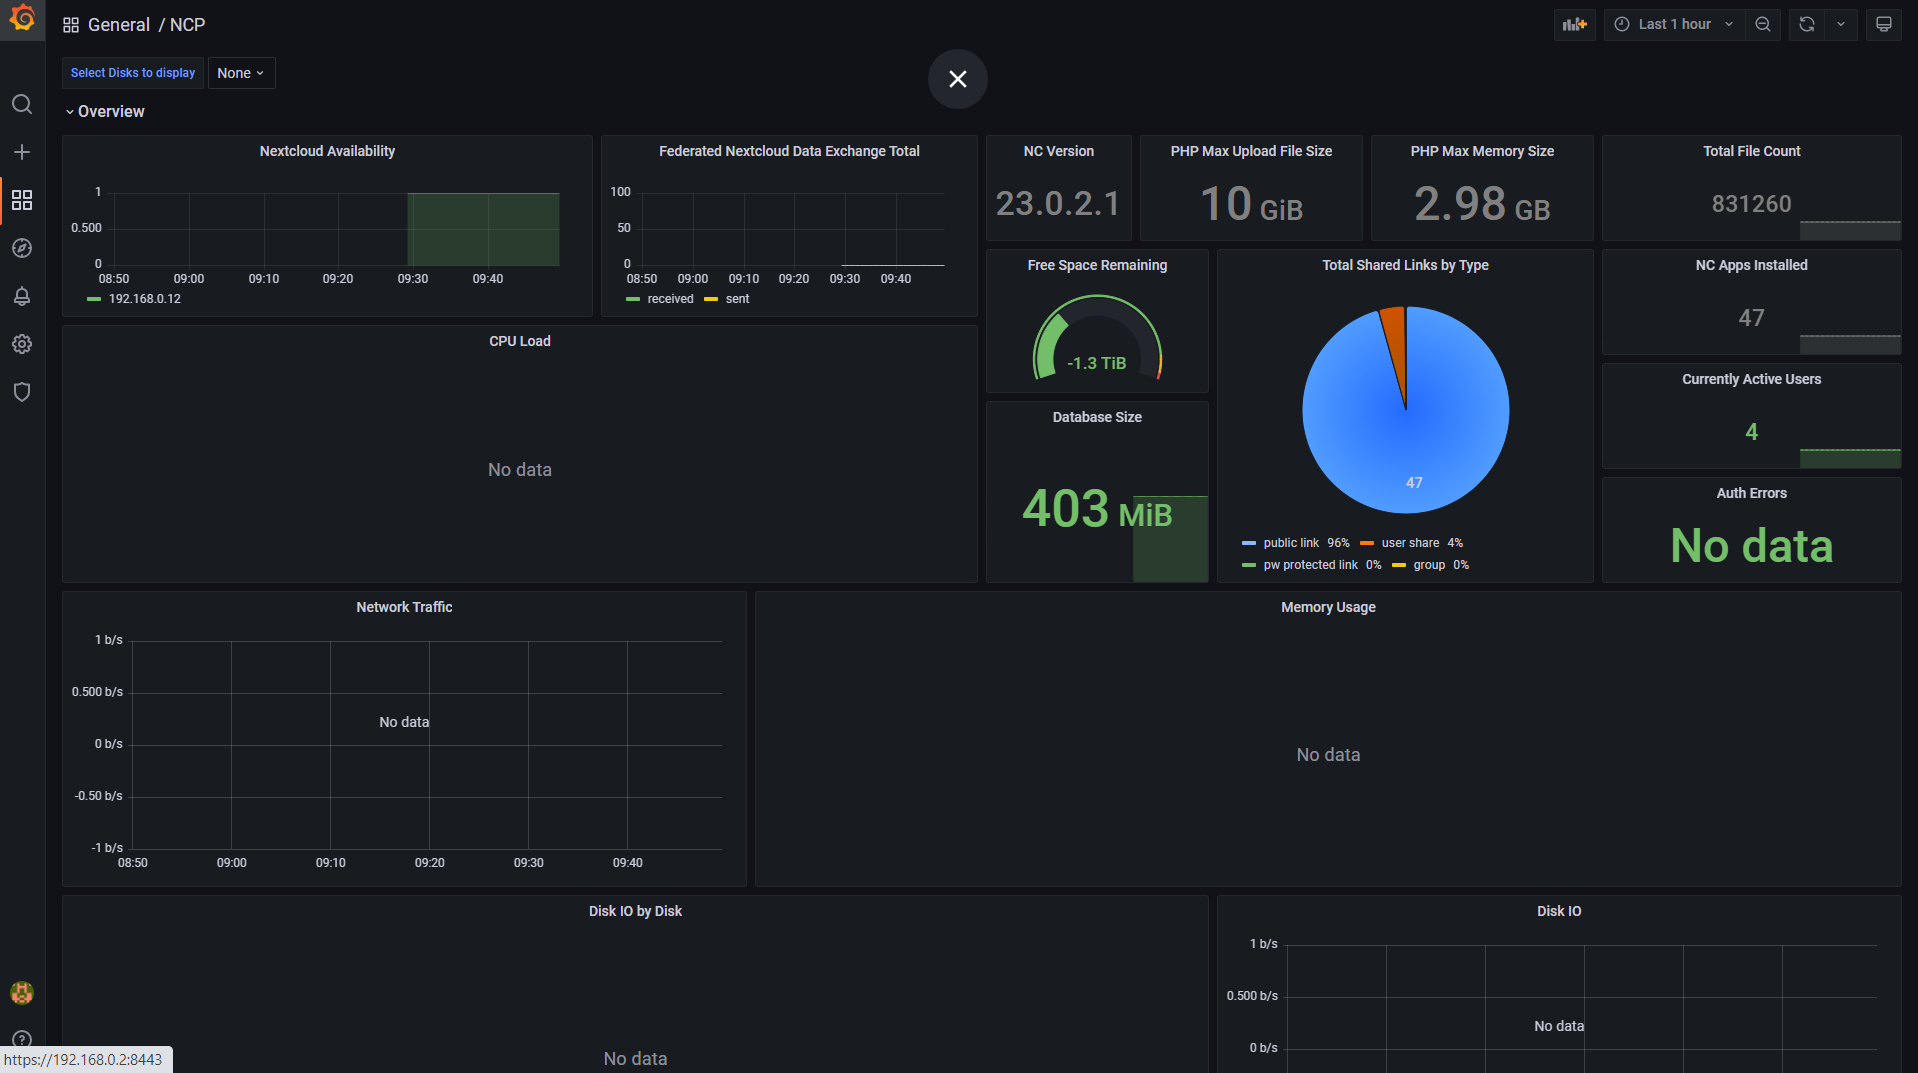
You can reach Grafana at https://localhost:8443
+ echo ''
+ read -r -N 1 -p 'Show logs? (Y|n)' choice
Show logs? (Y|n)n+ [[ n == \n ]]
In the logs of the 4 containers there is nothing strange
Yes. But can you please post again the output of ./start.sh
I didn’t expect the output above. But i don’t use the script either.
But perhaps it is only a formatting problem of this forum.
@ZackSpeed_Jesus Oh, apparently I left the debug flag in the start.sh script
Can you press “y” when asked for it while executing start.sh? That will show you the container logs which may contain errors related to your lack of metrics.
Please also give me the output of service prometheus-node-exporter status on your ncp server (not the system where your dashboard is running)
Okay, looks like we found the source of the issue.
Unfortunately the output looks cropped… Can you add the output of SYSTEMD_PAGER= ĵournalctl -eu prometheus-node-exporter?
EDIT: Actually, that might not be a big issue (I’ve just checked my prometheus-node-exporter logs and see similar errors - they just mean that some specific metric is not available for your system, like PSI). Your dashboard logs are probably more important.
Can you press ‘y’ when asked for it by start.sh and then paste the following output here?
ts=2022-04-13T09:52:59.392Z caller=main.go:479 level=info msg="No time or size retention was set so using the default time retention" duration=15d
ts=2022-04-13T09:52:59.392Z caller=main.go:516 level=info msg="Starting Prometheus" version="(version=2.34.0, branch=HEAD, revision=881111fec4332c33094a6fb2680c71fffc427275)"
ts=2022-04-13T09:52:59.392Z caller=main.go:521 level=info build_context="(go=go1.17.8, user=root@121ad7ea5487, date=20220315-15:18:00)"
ts=2022-04-13T09:52:59.392Z caller=main.go:522 level=info host_details="(Linux 5.4.0-107-generic #121-Ubuntu SMP Thu Mar 24 16:04:27 UTC 2022 x86_64 efa54a73f33a (none))"
ts=2022-04-13T09:52:59.392Z caller=main.go:523 level=info fd_limits="(soft=1048576, hard=1048576)"
ts=2022-04-13T09:52:59.392Z caller=main.go:524 level=info vm_limits="(soft=unlimited, hard=unlimited)"
ts=2022-04-13T09:52:59.394Z caller=web.go:540 level=info component=web msg="Start listening for connections" address=0.0.0.0:9090
ts=2022-04-13T09:52:59.394Z caller=main.go:937 level=info msg="Starting TSDB ..."
ts=2022-04-13T09:52:59.395Z caller=tls_config.go:195 level=info component=web msg="TLS is disabled." http2=false
ts=2022-04-13T09:52:59.396Z caller=head.go:493 level=info component=tsdb msg="Replaying on-disk memory mappable chunks if any"
ts=2022-04-13T09:52:59.396Z caller=head.go:536 level=info component=tsdb msg="On-disk memory mappable chunks replay completed" duration=1.622µs
ts=2022-04-13T09:52:59.396Z caller=head.go:542 level=info component=tsdb msg="Replaying WAL, this may take a while"
ts=2022-04-13T09:52:59.397Z caller=head.go:613 level=info component=tsdb msg="WAL segment loaded" segment=0 maxSegment=0
ts=2022-04-13T09:52:59.397Z caller=head.go:619 level=info component=tsdb msg="WAL replay completed" checkpoint_replay_duration=20.963µs wal_replay_duration=222.726µs total_replay_duration=257.524µs
ts=2022-04-13T09:52:59.398Z caller=main.go:958 level=info fs_type=EXT4_SUPER_MAGIC
ts=2022-04-13T09:52:59.398Z caller=main.go:961 level=info msg="TSDB started"
ts=2022-04-13T09:52:59.398Z caller=main.go:1142 level=info msg="Loading configuration file" filename=/etc/prometheus/prometheus.yml
ts=2022-04-13T09:52:59.398Z caller=main.go:1179 level=info msg="Completed loading of configuration file" filename=/etc/prometheus/prometheus.yml totalDuration=628.442µs db_storage=989ns remote_storage=1.12µs web_handler=345ns query_engine=631ns scrape=189.557µs scrape_sd=39.823µs notify=553ns notify_sd=1.247µs rules=964ns tracing=160.481µs
ts=2022-04-13T09:52:59.398Z caller=main.go:910 level=info msg="Server is ready to receive web requests.
"
NCP exporter
level=info msg="nextcloud-exporter 0.5.1-3-g401f463"
level=info msg="Nextcloud server: https://192.168.0.12 Authentication using token."
level=warning msg="HTTPS certificate verification is disabled."
level=info msg="Listen on :9025..."
level=error msg="Error during scrape: Get \"https://192.168.0.12/ocs/v2.php/apps/serverinfo/api/v1/info?format=json\": dial tcp 192.168.0.12:443: connect: connection refused"
level=error msg="Error during scrape: Get \"https://192.168.0.12/ocs/v2.php/apps/serverinfo/api/v1/info?format=json\": context deadline exceeded (Client.Timeout exceeded while awaiting headers)"
level=error msg="Error during scrape: Get \"https://192.168.0.12/ocs/v2.php/apps/serverinfo/api/v1/info?format=json\": dial tcp 192.168.0.12:443: connect: no route to host"
level=error msg="Error during scrape: unexpected status code: 500"
level=error msg="Error during scrape: unexpected status code: 500"
level=error msg="Error during scrape: Get \"https://192.168.0.12/ocs/v2.php/apps/serverinfo/api/v1/info?format=json\": context deadline exceeded (Client.Timeout exceeded while awaiting headers)"
level=error msg="Error during scrape: Get \"https://192.168.0.12/ocs/v2.php/apps/serverinfo/api/v1/info?format=json\": context deadline exceeded (Client.Timeout exceeded while awaiting headers)"
level=error msg="Error during scrape: Get \"https://192.168.0.12/ocs/v2.php/apps/serverinfo/api/v1/info?format=json\": context deadline exceeded (Client.Timeout exceeded while awaiting headers)"
Okay, I have a suspicion… Can you do docker-compose down && docker-compose pull && docker-compose rm inside the ncp-monitoring-dashboard directory and then restart the services (docker-compose up or ./start.sh)? I was able to reproduce your issue with an older prometheus image.
root@servidor-datagal:/home/pi/ncp-monitoring-dashboard# docker-compose down && docker-compose pull && docker-compose rm
Stopping ncp-monitoring-dashboard_prometheus_1             ... done
Stopping ncp-monitoring-dashboard_nginx_1                  ... done
Stopping ncp-monitoring-dashboard_ncp-nextcloud-exporter_1 ... done
Stopping ncp-monitoring-dashboard_grafana_1                ... done
Removing ncp-monitoring-dashboard_prometheus_1             ... done
Removing ncp-monitoring-dashboard_nginx_1                  ... done
Removing ncp-monitoring-dashboard_ncp-nextcloud-exporter_1 ... done
Removing ncp-monitoring-dashboard_grafana_1                ... done
Removing network ncp-monitoring
Pulling nginx                  ... done
Pulling ncp-nextcloud-exporter ... done
Pulling prometheus             ... done
Pulling grafana                ... done
No stopped containers
root@servidor-datagal:/home/pi/ncp-monitoring-dashboard# ./start.sh


Do you want to install ncp-monitoring-dashboard as a systemd service? This is ideal for persistent hosting. (y|N)y

Services are starting up. In the future you can start them by executing 'systemctl start ncp-monitoring-dashboard' and stop them by executing 'systemctl stop ncp-monitoring-dashboard' from this directory.
You can reach Grafana at https://localhost:8443

Show logs? (Y|n)n
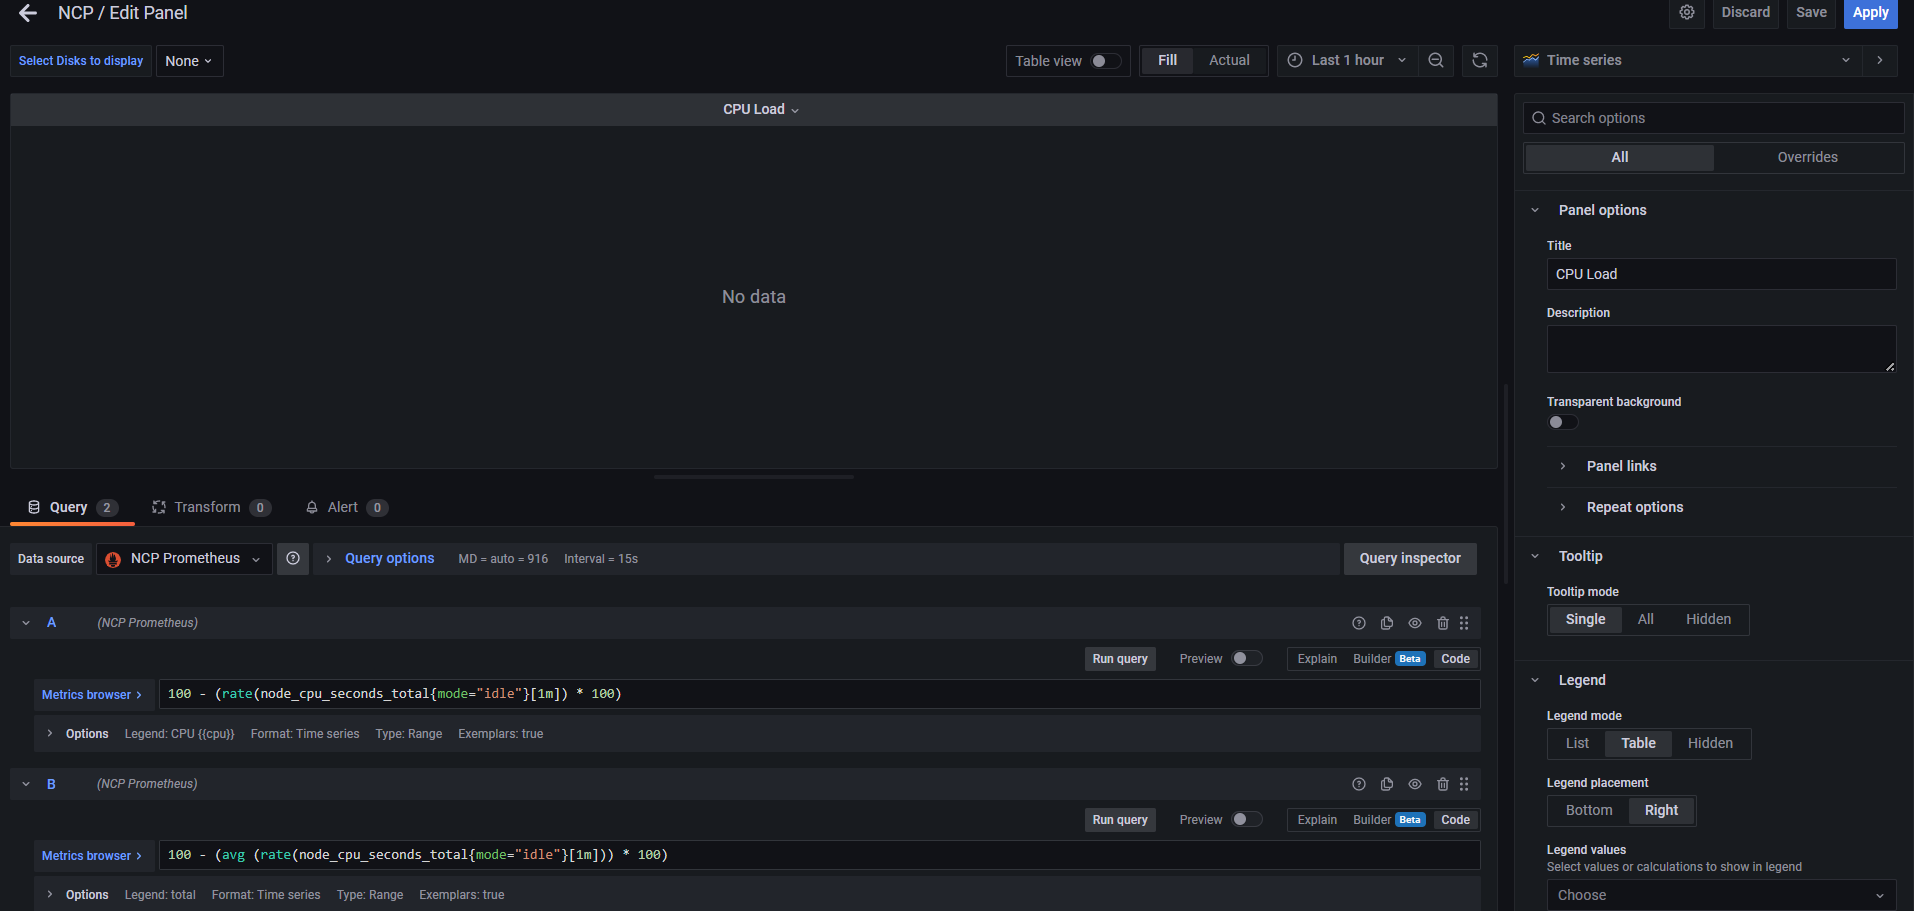
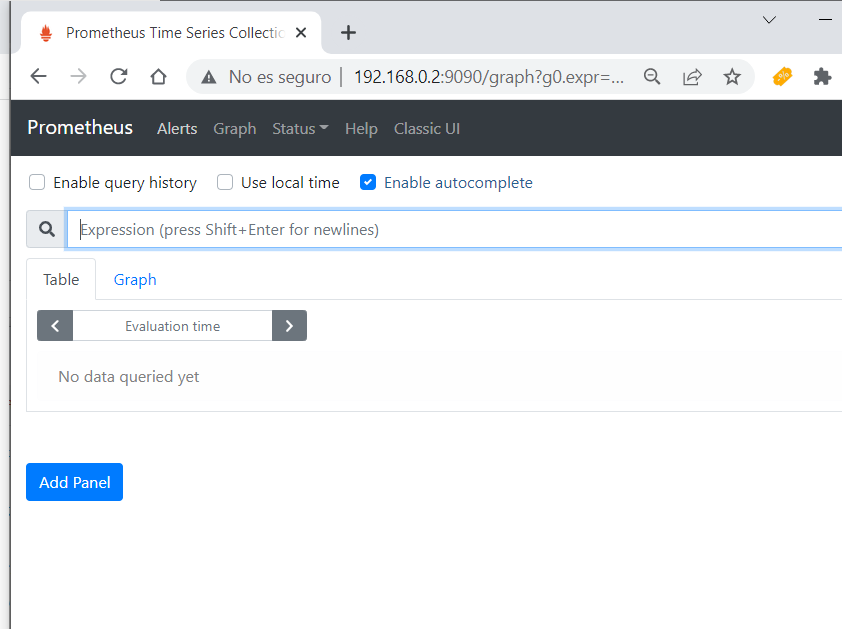
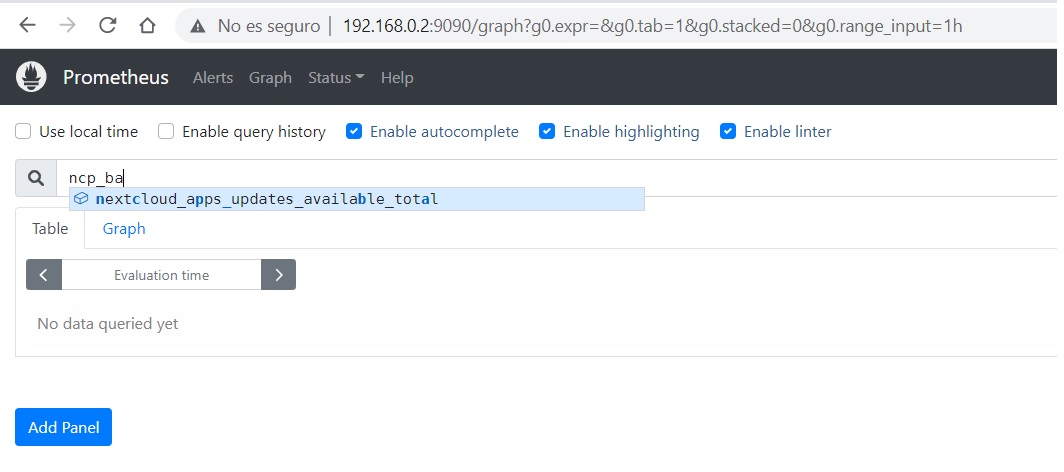
You could access the Prometheus UI directly at http://<container-ip>:9090 (get the container IP with docker inspect <container-name> -f '{{range.NetworkSettings.Networks}}{{.IPAddress}}{{end}}') and see if you can create a panel and retrieve any metrics.
# HELP ncp_backup_freshness Age of the latest backup in minutes.
# TYPE ncp_backup_freshness gauge
ncp_backup_freshness{backups_disk="/dev/root",backups_path="/media/USBdrive/ncp-snapshots",backup_pattern=".*_(?P<year>\d+)-(?P<month>\d+)-(?P<day>\d+)_(?P<hour>\d{2})(?P<minute>\d{2})(?P<second>\d{2})"} 17528889
ncp_backup_freshness{backups_disk="/dev/sdb1",backups_path="/media/zBackUp/ncp-snapshots-sync",backup_pattern=".*_(?P<year>\d+)-(?P<month>\d+)-(?P<day>\d+)_(?P<hour>\d{2})(?P<minute>\d{2})(?P<second>\d{2})"} 17561289
ncp_backup_freshness{backups_disk="/dev/sdb1",backups_path="/media/zBackUp/ncp-backups",backup_pattern="nextcloud-bkp_(?P<year>\d{4})(?P<month>\d{2})(?P<day>\d{2})_.*\.tar(\.gz)?"} 17749510
# EOF
# HELP apt_autoremove_pending Apt package pending autoremove.
# TYPE apt_autoremove_pending gauge
apt_autoremove_pending 0
# HELP apt_upgrades_pending Apt package pending updates by origin.
# TYPE apt_upgrades_pending gauge
apt_upgrades_pending{arch="",origin=""} 0
# HELP go_gc_duration_seconds A summary of the pause duration of garbage collection cycles.
# TYPE go_gc_duration_seconds summary
go_gc_duration_seconds{quantile="0"} 9.0497e-05
go_gc_duration_seconds{quantile="0.25"} 0.000105072
go_gc_duration_seconds{quantile="0.5"} 0.000134719
go_gc_duration_seconds{quantile="0.75"} 0.000243771
go_gc_duration_seconds{quantile="1"} 0.006901477
go_gc_duration_seconds_sum 0.013102619
go_gc_duration_seconds_count 28
# HELP go_goroutines Number of goroutines that currently exist.
# TYPE go_goroutines gauge
go_goroutines 10
# HELP go_info Information about the Go environment.
# TYPE go_info gauge
go_info{version="go1.15.9"} 1
# HELP go_memstats_alloc_bytes Number of bytes allocated and still in use.
# TYPE go_memstats_alloc_bytes gauge
go_memstats_alloc_bytes 2.237856e+06
# HELP go_memstats_alloc_bytes_total Total number of bytes allocated, even if freed.
# TYPE go_memstats_alloc_bytes_total counter
go_memstats_alloc_bytes_total 3.9672192e+07
# HELP go_memstats_buck_hash_sys_bytes Number of bytes used by the profiling bucket hash table.
# TYPE go_memstats_buck_hash_sys_bytes gauge
go_memstats_buck_hash_sys_bytes 1.454919e+06
# HELP go_memstats_frees_total Total number of frees.
# TYPE go_memstats_frees_total counter
go_memstats_frees_total 795327
# HELP go_memstats_gc_cpu_fraction The fraction of this program's available CPU time used by the GC since the program started.
# TYPE go_memstats_gc_cpu_fraction gauge
go_memstats_gc_cpu_fraction 1.8238090765150252e-07
# HELP go_memstats_gc_sys_bytes Number of bytes used for garbage collection system metadata.
# TYPE go_memstats_gc_sys_bytes gauge
go_memstats_gc_sys_bytes 5.071632e+06
# HELP go_memstats_heap_alloc_bytes Number of heap bytes allocated and still in use.
# TYPE go_memstats_heap_alloc_bytes gauge
go_memstats_heap_alloc_bytes 2.237856e+06
# HELP go_memstats_heap_idle_bytes Number of heap bytes waiting to be used.
# TYPE go_memstats_heap_idle_bytes gauge
go_memstats_heap_idle_bytes 6.1874176e+07
# HELP go_memstats_heap_inuse_bytes Number of heap bytes that are in use.
# TYPE go_memstats_heap_inuse_bytes gauge
go_memstats_heap_inuse_bytes 4.579328e+06
# HELP go_memstats_heap_objects Number of allocated objects.
# TYPE go_memstats_heap_objects gauge
go_memstats_heap_objects 22581
# HELP go_memstats_heap_released_bytes Number of heap bytes released to OS.
# TYPE go_memstats_heap_released_bytes gauge
go_memstats_heap_released_bytes 6.1513728e+07
# HELP go_memstats_heap_sys_bytes Number of heap bytes obtained from system.
# TYPE go_memstats_heap_sys_bytes gauge
go_memstats_heap_sys_bytes 6.6453504e+07
# HELP go_memstats_last_gc_time_seconds Number of seconds since 1970 of last garbage collection.
# TYPE go_memstats_last_gc_time_seconds gauge
go_memstats_last_gc_time_seconds 1.650014970506678e+09
# HELP go_memstats_lookups_total Total number of pointer lookups.
# TYPE go_memstats_lookups_total counter
go_memstats_lookups_total 0
# HELP go_memstats_mallocs_total Total number of mallocs.
# TYPE go_memstats_mallocs_total counter
go_memstats_mallocs_total 817908
# HELP go_memstats_mcache_inuse_bytes Number of bytes in use by mcache structures.
# TYPE go_memstats_mcache_inuse_bytes gauge
go_memstats_mcache_inuse_bytes 6944
# HELP go_memstats_mcache_sys_bytes Number of bytes used for mcache structures obtained from system.
# TYPE go_memstats_mcache_sys_bytes gauge
go_memstats_mcache_sys_bytes 16384
# HELP go_memstats_mspan_inuse_bytes Number of bytes in use by mspan structures.
# TYPE go_memstats_mspan_inuse_bytes gauge
go_memstats_mspan_inuse_bytes 108528
# HELP go_memstats_mspan_sys_bytes Number of bytes used for mspan structures obtained from system.
# TYPE go_memstats_mspan_sys_bytes gauge
go_memstats_mspan_sys_bytes 131072
# HELP go_memstats_next_gc_bytes Number of heap bytes when next garbage collection will take place.
# TYPE go_memstats_next_gc_bytes gauge
go_memstats_next_gc_bytes 4.194304e+06
# HELP go_memstats_other_sys_bytes Number of bytes used for other system allocations.
# TYPE go_memstats_other_sys_bytes gauge
go_memstats_other_sys_bytes 486825
# HELP go_memstats_stack_inuse_bytes Number of bytes in use by the stack allocator.
# TYPE go_memstats_stack_inuse_bytes gauge
go_memstats_stack_inuse_bytes 655360
# HELP go_memstats_stack_sys_bytes Number of bytes obtained from system for stack allocator.
# TYPE go_memstats_stack_sys_bytes gauge
go_memstats_stack_sys_bytes 655360
# HELP go_memstats_sys_bytes Number of bytes obtained from system.
# TYPE go_memstats_sys_bytes gauge
go_memstats_sys_bytes 7.4269696e+07
# HELP go_threads Number of OS threads created.
# TYPE go_threads gauge
go_threads 9
# HELP node_arp_entries ARP entries by device
# TYPE node_arp_entries gauge
node_arp_entries{device="eth0"} 3
# HELP node_boot_time_seconds Node boot time, in unixtime.
# TYPE node_boot_time_seconds gauge
node_boot_time_seconds 1.649844636e+09
# HELP node_btrfs_allocation_ratio Data allocation ratio for a layout/data type
# TYPE node_btrfs_allocation_ratio gauge
node_btrfs_allocation_ratio{block_group_type="data",mode="single",uuid="1c6ae09f-89bf-4742-bb11-f4d066f984a8"} 1
node_btrfs_allocation_ratio{block_group_type="data",mode="single",uuid="e1c9fe24-5093-4edb-b93a-e4da4d2e2680"} 1
node_btrfs_allocation_ratio{block_group_type="metadata",mode="dup",uuid="1c6ae09f-89bf-4742-bb11-f4d066f984a8"} 2
node_btrfs_allocation_ratio{block_group_type="metadata",mode="dup",uuid="e1c9fe24-5093-4edb-b93a-e4da4d2e2680"} 2
node_btrfs_allocation_ratio{block_group_type="system",mode="dup",uuid="1c6ae09f-89bf-4742-bb11-f4d066f984a8"} 2
node_btrfs_allocation_ratio{block_group_type="system",mode="dup",uuid="e1c9fe24-5093-4edb-b93a-e4da4d2e2680"} 2
# HELP node_btrfs_device_size_bytes Size of a device that is part of the filesystem.
# TYPE node_btrfs_device_size_bytes gauge
node_btrfs_device_size_bytes{device="sda1",uuid="e1c9fe24-5093-4edb-b93a-e4da4d2e2680"} 3.000591450112e+12
node_btrfs_device_size_bytes{device="sdb1",uuid="1c6ae09f-89bf-4742-bb11-f4d066f984a8"} 4.000785104896e+12
# HELP node_btrfs_global_rsv_size_bytes Size of global reserve.
# TYPE node_btrfs_global_rsv_size_bytes gauge
node_btrfs_global_rsv_size_bytes{uuid="1c6ae09f-89bf-4742-bb11-f4d066f984a8"} 5.36870912e+08
node_btrfs_global_rsv_size_bytes{uuid="e1c9fe24-5093-4edb-b93a-e4da4d2e2680"} 5.36870912e+08
# HELP node_btrfs_info Filesystem information
# TYPE node_btrfs_info gauge
node_btrfs_info{label="myCloudDrive",uuid="e1c9fe24-5093-4edb-b93a-e4da4d2e2680"} 1
node_btrfs_info{label="zBackUp",uuid="1c6ae09f-89bf-4742-bb11-f4d066f984a8"} 1
# HELP node_btrfs_reserved_bytes Amount of space reserved for a data type
# TYPE node_btrfs_reserved_bytes gauge
node_btrfs_reserved_bytes{block_group_type="data",uuid="1c6ae09f-89bf-4742-bb11-f4d066f984a8"} 0
node_btrfs_reserved_bytes{block_group_type="data",uuid="e1c9fe24-5093-4edb-b93a-e4da4d2e2680"} 0
node_btrfs_reserved_bytes{block_group_type="metadata",uuid="1c6ae09f-89bf-4742-bb11-f4d066f984a8"} 0
node_btrfs_reserved_bytes{block_group_type="metadata",uuid="e1c9fe24-5093-4edb-b93a-e4da4d2e2680"} 0
node_btrfs_reserved_bytes{block_group_type="system",uuid="1c6ae09f-89bf-4742-bb11-f4d066f984a8"} 0
node_btrfs_reserved_bytes{block_group_type="system",uuid="e1c9fe24-5093-4edb-b93a-e4da4d2e2680"} 0
# HELP node_btrfs_size_bytes Amount of space allocated for a layout/data type
# TYPE node_btrfs_size_bytes gauge
node_btrfs_size_bytes{block_group_type="data",mode="single",uuid="1c6ae09f-89bf-4742-bb11-f4d066f984a8"} 1.526869262336e+12
node_btrfs_size_bytes{block_group_type="data",mode="single",uuid="e1c9fe24-5093-4edb-b93a-e4da4d2e2680"} 1.594514997248e+12
node_btrfs_size_bytes{block_group_type="metadata",mode="dup",uuid="1c6ae09f-89bf-4742-bb11-f4d066f984a8"} 6.442450944e+09
node_btrfs_size_bytes{block_group_type="metadata",mode="dup",uuid="e1c9fe24-5093-4edb-b93a-e4da4d2e2680"} 8.589934592e+09
node_btrfs_size_bytes{block_group_type="system",mode="dup",uuid="1c6ae09f-89bf-4742-bb11-f4d066f984a8"} 8.388608e+06
node_btrfs_size_bytes{block_group_type="system",mode="dup",uuid="e1c9fe24-5093-4edb-b93a-e4da4d2e2680"} 8.388608e+06
# HELP node_btrfs_used_bytes Amount of used space by a layout/data type
# TYPE node_btrfs_used_bytes gauge
node_btrfs_used_bytes{block_group_type="data",mode="single",uuid="1c6ae09f-89bf-4742-bb11-f4d066f984a8"} 1.525163810816e+12
node_btrfs_used_bytes{block_group_type="data",mode="single",uuid="e1c9fe24-5093-4edb-b93a-e4da4d2e2680"} 1.501138214912e+12
node_btrfs_used_bytes{block_group_type="metadata",mode="dup",uuid="1c6ae09f-89bf-4742-bb11-f4d066f984a8"} 6.107103232e+09
node_btrfs_used_bytes{block_group_type="metadata",mode="dup",uuid="e1c9fe24-5093-4edb-b93a-e4da4d2e2680"} 4.123459584e+09
node_btrfs_used_bytes{block_group_type="system",mode="dup",uuid="1c6ae09f-89bf-4742-bb11-f4d066f984a8"} 180224
node_btrfs_used_bytes{block_group_type="system",mode="dup",uuid="e1c9fe24-5093-4edb-b93a-e4da4d2e2680"} 180224
# HELP node_context_switches_total Total number of context switches.
# TYPE node_context_switches_total counter
node_context_switches_total 8.1937594e+07
# HELP node_cpu_frequency_max_hertz Maximum cpu thread frequency in hertz.
# TYPE node_cpu_frequency_max_hertz gauge
node_cpu_frequency_max_hertz{cpu="0"} 1.5e+09
node_cpu_frequency_max_hertz{cpu="1"} 1.5e+09
node_cpu_frequency_max_hertz{cpu="2"} 1.5e+09
node_cpu_frequency_max_hertz{cpu="3"} 1.5e+09
# HELP node_cpu_frequency_min_hertz Minimum cpu thread frequency in hertz.
# TYPE node_cpu_frequency_min_hertz gauge
node_cpu_frequency_min_hertz{cpu="0"} 6e+08
node_cpu_frequency_min_hertz{cpu="1"} 6e+08
node_cpu_frequency_min_hertz{cpu="2"} 6e+08
node_cpu_frequency_min_hertz{cpu="3"} 6e+08
# HELP node_cpu_guest_seconds_total Seconds the CPUs spent in guests (VMs) for each mode.
# TYPE node_cpu_guest_seconds_total counter
node_cpu_guest_seconds_total{cpu="0",mode="nice"} 0
node_cpu_guest_seconds_total{cpu="0",mode="user"} 0
node_cpu_guest_seconds_total{cpu="1",mode="nice"} 0
node_cpu_guest_seconds_total{cpu="1",mode="user"} 0
node_cpu_guest_seconds_total{cpu="2",mode="nice"} 0
node_cpu_guest_seconds_total{cpu="2",mode="user"} 0
node_cpu_guest_seconds_total{cpu="3",mode="nice"} 0
node_cpu_guest_seconds_total{cpu="3",mode="user"} 0
# HELP node_cpu_scaling_frequency_hertz Current scaled CPU thread frequency in hertz.
# TYPE node_cpu_scaling_frequency_hertz gauge
node_cpu_scaling_frequency_hertz{cpu="0"} 1.5e+09
node_cpu_scaling_frequency_hertz{cpu="1"} 1.5e+09
node_cpu_scaling_frequency_hertz{cpu="2"} 1.5e+09
node_cpu_scaling_frequency_hertz{cpu="3"} 1.5e+09
# HELP node_cpu_scaling_frequency_max_hertz Maximum scaled CPU thread frequency in hertz.
# TYPE node_cpu_scaling_frequency_max_hertz gauge
node_cpu_scaling_frequency_max_hertz{cpu="0"} 1.5e+09
node_cpu_scaling_frequency_max_hertz{cpu="1"} 1.5e+09
node_cpu_scaling_frequency_max_hertz{cpu="2"} 1.5e+09
node_cpu_scaling_frequency_max_hertz{cpu="3"} 1.5e+09
# HELP node_cpu_scaling_frequency_min_hertz Minimum scaled CPU thread frequency in hertz.
# TYPE node_cpu_scaling_frequency_min_hertz gauge
node_cpu_scaling_frequency_min_hertz{cpu="0"} 6e+08
node_cpu_scaling_frequency_min_hertz{cpu="1"} 6e+08
node_cpu_scaling_frequency_min_hertz{cpu="2"} 6e+08
node_cpu_scaling_frequency_min_hertz{cpu="3"} 6e+08
# HELP node_cpu_seconds_total Seconds the CPUs spent in each mode.
# TYPE node_cpu_seconds_total counter
node_cpu_seconds_total{cpu="0",mode="idle"} 163457.34
node_cpu_seconds_total{cpu="0",mode="iowait"} 1319.35
node_cpu_seconds_total{cpu="0",mode="irq"} 0
node_cpu_seconds_total{cpu="0",mode="nice"} 18.28
node_cpu_seconds_total{cpu="0",mode="softirq"} 38.7
node_cpu_seconds_total{cpu="0",mode="steal"} 0
node_cpu_seconds_total{cpu="0",mode="system"} 898.94
node_cpu_seconds_total{cpu="0",mode="user"} 4301.52
node_cpu_seconds_total{cpu="1",mode="idle"} 162819.61
node_cpu_seconds_total{cpu="1",mode="iowait"} 1051.28
node_cpu_seconds_total{cpu="1",mode="irq"} 0
node_cpu_seconds_total{cpu="1",mode="nice"} 18.84
node_cpu_seconds_total{cpu="1",mode="softirq"} 3.99
node_cpu_seconds_total{cpu="1",mode="steal"} 0
node_cpu_seconds_total{cpu="1",mode="system"} 1074.99
node_cpu_seconds_total{cpu="1",mode="user"} 5119.49
node_cpu_seconds_total{cpu="2",mode="idle"} 162491.8
node_cpu_seconds_total{cpu="2",mode="iowait"} 1180.7
node_cpu_seconds_total{cpu="2",mode="irq"} 0
node_cpu_seconds_total{cpu="2",mode="nice"} 19.72
node_cpu_seconds_total{cpu="2",mode="softirq"} 4.12
node_cpu_seconds_total{cpu="2",mode="steal"} 0
node_cpu_seconds_total{cpu="2",mode="system"} 1107.17
node_cpu_seconds_total{cpu="2",mode="user"} 5252.56
node_cpu_seconds_total{cpu="3",mode="idle"} 162860.36
node_cpu_seconds_total{cpu="3",mode="iowait"} 1217.55
node_cpu_seconds_total{cpu="3",mode="irq"} 0
node_cpu_seconds_total{cpu="3",mode="nice"} 26.83
node_cpu_seconds_total{cpu="3",mode="softirq"} 3.59
node_cpu_seconds_total{cpu="3",mode="steal"} 0
node_cpu_seconds_total{cpu="3",mode="system"} 1021.4
node_cpu_seconds_total{cpu="3",mode="user"} 4962.07
# HELP node_disk_discard_time_seconds_total This is the total number of seconds spent by all discards.
# TYPE node_disk_discard_time_seconds_total counter
node_disk_discard_time_seconds_total{device="mmcblk0"} 0
node_disk_discard_time_seconds_total{device="mmcblk0p1"} 0
node_disk_discard_time_seconds_total{device="mmcblk0p2"} 0
node_disk_discard_time_seconds_total{device="sda"} 0
node_disk_discard_time_seconds_total{device="sdb"} 0
# HELP node_disk_discarded_sectors_total The total number of sectors discarded successfully.
# TYPE node_disk_discarded_sectors_total counter
node_disk_discarded_sectors_total{device="mmcblk0"} 0
node_disk_discarded_sectors_total{device="mmcblk0p1"} 0
node_disk_discarded_sectors_total{device="mmcblk0p2"} 0
node_disk_discarded_sectors_total{device="sda"} 0
node_disk_discarded_sectors_total{device="sdb"} 0
# HELP node_disk_discards_completed_total The total number of discards completed successfully.
# TYPE node_disk_discards_completed_total counter
node_disk_discards_completed_total{device="mmcblk0"} 0
node_disk_discards_completed_total{device="mmcblk0p1"} 0
node_disk_discards_completed_total{device="mmcblk0p2"} 0
node_disk_discards_completed_total{device="sda"} 0
node_disk_discards_completed_total{device="sdb"} 0
# HELP node_disk_discards_merged_total The total number of discards merged.
# TYPE node_disk_discards_merged_total counter
node_disk_discards_merged_total{device="mmcblk0"} 0
node_disk_discards_merged_total{device="mmcblk0p1"} 0
node_disk_discards_merged_total{device="mmcblk0p2"} 0
node_disk_discards_merged_total{device="sda"} 0
node_disk_discards_merged_total{device="sdb"} 0
# HELP node_disk_flush_requests_time_seconds_total This is the total number of seconds spent by all flush requests.
# TYPE node_disk_flush_requests_time_seconds_total counter
node_disk_flush_requests_time_seconds_total{device="mmcblk0"} 0
node_disk_flush_requests_time_seconds_total{device="mmcblk0p1"} 0
node_disk_flush_requests_time_seconds_total{device="mmcblk0p2"} 0
node_disk_flush_requests_time_seconds_total{device="sda"} 137.1
node_disk_flush_requests_time_seconds_total{device="sdb"} 0.25
# HELP node_disk_flush_requests_total The total number of flush requests completed successfully
# TYPE node_disk_flush_requests_total counter
node_disk_flush_requests_total{device="mmcblk0"} 0
node_disk_flush_requests_total{device="mmcblk0p1"} 0
node_disk_flush_requests_total{device="mmcblk0p2"} 0
node_disk_flush_requests_total{device="sda"} 2090
node_disk_flush_requests_total{device="sdb"} 2
# HELP node_disk_io_now The number of I/Os currently in progress.
# TYPE node_disk_io_now gauge
node_disk_io_now{device="mmcblk0"} 0
node_disk_io_now{device="mmcblk0p1"} 0
node_disk_io_now{device="mmcblk0p2"} 0
node_disk_io_now{device="sda"} 0
node_disk_io_now{device="sdb"} 0
# HELP node_disk_io_time_seconds_total Total seconds spent doing I/Os.
# TYPE node_disk_io_time_seconds_total counter
node_disk_io_time_seconds_total{device="mmcblk0"} 5272.692
node_disk_io_time_seconds_total{device="mmcblk0p1"} 3.484
node_disk_io_time_seconds_total{device="mmcblk0p2"} 5272.424
node_disk_io_time_seconds_total{device="sda"} 426.47200000000004
node_disk_io_time_seconds_total{device="sdb"} 23.252
# HELP node_disk_io_time_weighted_seconds_total The weighted # of seconds spent doing I/Os.
# TYPE node_disk_io_time_weighted_seconds_total counter
node_disk_io_time_weighted_seconds_total{device="mmcblk0"} 93395.897
node_disk_io_time_weighted_seconds_total{device="mmcblk0p1"} 6.212
node_disk_io_time_weighted_seconds_total{device="mmcblk0p2"} 93389.504
node_disk_io_time_weighted_seconds_total{device="sda"} 5896.3
node_disk_io_time_weighted_seconds_total{device="sdb"} 32.555
# HELP node_disk_read_bytes_total The total number of bytes read successfully.
# TYPE node_disk_read_bytes_total counter
node_disk_read_bytes_total{device="mmcblk0"} 1.079576576e+09
node_disk_read_bytes_total{device="mmcblk0p1"} 1.1301888e+07
node_disk_read_bytes_total{device="mmcblk0p2"} 1.067037696e+09
node_disk_read_bytes_total{device="sda"} 5.686082048e+09
node_disk_read_bytes_total{device="sdb"} 1.13080832e+08
# HELP node_disk_read_time_seconds_total The total number of seconds spent by all reads.
# TYPE node_disk_read_time_seconds_total counter
node_disk_read_time_seconds_total{device="mmcblk0"} 311.234
node_disk_read_time_seconds_total{device="mmcblk0p1"} 5.324
node_disk_read_time_seconds_total{device="mmcblk0p2"} 305.73
node_disk_read_time_seconds_total{device="sda"} 1237.894
node_disk_read_time_seconds_total{device="sdb"} 29.536
# HELP node_disk_reads_completed_total The total number of reads completed successfully.
# TYPE node_disk_reads_completed_total counter
node_disk_reads_completed_total{device="mmcblk0"} 37012
node_disk_reads_completed_total{device="mmcblk0p1"} 315
node_disk_reads_completed_total{device="mmcblk0p2"} 36607
node_disk_reads_completed_total{device="sda"} 198534
node_disk_reads_completed_total{device="sdb"} 5503
# HELP node_disk_reads_merged_total The total number of reads merged.
# TYPE node_disk_reads_merged_total counter
node_disk_reads_merged_total{device="mmcblk0"} 15106
node_disk_reads_merged_total{device="mmcblk0p1"} 3019
node_disk_reads_merged_total{device="mmcblk0p2"} 12087
node_disk_reads_merged_total{device="sda"} 102
node_disk_reads_merged_total{device="sdb"} 1
# HELP node_disk_write_time_seconds_total This is the total number of seconds spent by all writes.
# TYPE node_disk_write_time_seconds_total counter
node_disk_write_time_seconds_total{device="mmcblk0"} 93084.662
node_disk_write_time_seconds_total{device="mmcblk0p1"} 0.888
node_disk_write_time_seconds_total{device="mmcblk0p2"} 93083.774
node_disk_write_time_seconds_total{device="sda"} 4521.305
node_disk_write_time_seconds_total{device="sdb"} 2.7680000000000002
# HELP node_disk_writes_completed_total The total number of writes completed successfully.
# TYPE node_disk_writes_completed_total counter
node_disk_writes_completed_total{device="mmcblk0"} 367622
node_disk_writes_completed_total{device="mmcblk0p1"} 2
node_disk_writes_completed_total{device="mmcblk0p2"} 367620
node_disk_writes_completed_total{device="sda"} 88545
node_disk_writes_completed_total{device="sdb"} 140
# HELP node_disk_writes_merged_total The number of writes merged.
# TYPE node_disk_writes_merged_total counter
node_disk_writes_merged_total{device="mmcblk0"} 724342
node_disk_writes_merged_total{device="mmcblk0p1"} 0
node_disk_writes_merged_total{device="mmcblk0p2"} 724342
The only other thing that comes to mind is that prometheus might not like your self-signed certificate or something - but then again, I’d expect an error in the logs if that was the cause.