ts=2022-04-18T08:29:02.323Z caller=main.go:479 level=info msg="No time or size retention was set so using the default time retention" duration=15d
ts=2022-04-18T08:29:02.323Z caller=main.go:516 level=info msg="Starting Prometheus" version="(version=2.34.0, branch=HEAD, revision=881111fec4332c33094a6fb2680c71fffc427275)"
ts=2022-04-18T08:29:02.323Z caller=main.go:521 level=info build_context="(go=go1.17.8, user=root@121ad7ea5487, date=20220315-15:18:00)"
ts=2022-04-18T08:29:02.323Z caller=main.go:522 level=info host_details="(Linux 5.4.0-107-generic #121-Ubuntu SMP Thu Mar 24 16:04:27 UTC 2022 x86_64 1d7fd5a5c357 (none))"
ts=2022-04-18T08:29:02.323Z caller=main.go:523 level=info fd_limits="(soft=1048576, hard=1048576)"
ts=2022-04-18T08:29:02.323Z caller=main.go:524 level=info vm_limits="(soft=unlimited, hard=unlimited)"
ts=2022-04-18T08:29:02.325Z caller=web.go:540 level=info component=web msg="Start listening for connections" address=0.0.0.0:9090
ts=2022-04-18T08:29:02.325Z caller=main.go:937 level=info msg="Starting TSDB ..."
ts=2022-04-18T08:29:02.326Z caller=repair.go:57 level=info component=tsdb msg="Found healthy block" mint=1650056830825 maxt=1650067200000 ulid=01G0RBW24R4EHFX05CVN0GK4CC
ts=2022-04-18T08:29:02.326Z caller=repair.go:57 level=info component=tsdb msg="Found healthy block" mint=1650067201920 maxt=1650132000000 ulid=01G0T9NKD6Z80GND5NYAFP1QXZ
ts=2022-04-18T08:29:02.326Z caller=repair.go:57 level=info component=tsdb msg="Found healthy block" mint=1650132001920 maxt=1650196800000 ulid=01G0W7F4QJ3PQCPDMMG30Z2C7Q
ts=2022-04-18T08:29:02.326Z caller=repair.go:57 level=info component=tsdb msg="Found healthy block" mint=1650196801920 maxt=1650218400000 ulid=01G0WW2AC5A3T39ZCT934Q8QQH
ts=2022-04-18T08:29:02.326Z caller=repair.go:57 level=info component=tsdb msg="Found healthy block" mint=1650240001920 maxt=1650247200000 ulid=01G0X9SRTQTM8GN6MRR1F8SPN8
ts=2022-04-18T08:29:02.326Z caller=repair.go:57 level=info component=tsdb msg="Found healthy block" mint=1650247201920 maxt=1650254400000 ulid=01G0XGNG2QGW16190G8G1WQZJC
ts=2022-04-18T08:29:02.326Z caller=repair.go:57 level=info component=tsdb msg="Found healthy block" mint=1650218401920 maxt=1650240000000 ulid=01G0XGNG5FBF1T24NXGDH85PVY
ts=2022-04-18T08:29:02.326Z caller=repair.go:57 level=info component=tsdb msg="Found healthy block" mint=1650254401920 maxt=1650261600000 ulid=01G0XQH7APD4H0JA8WG0GSA0CG
ts=2022-04-18T08:29:02.327Z caller=tls_config.go:195 level=info component=web msg="TLS is disabled." http2=false
ts=2022-04-18T08:29:02.332Z caller=head.go:493 level=info component=tsdb msg="Replaying on-disk memory mappable chunks if any"
ts=2022-04-18T08:29:02.333Z caller=head.go:536 level=info component=tsdb msg="On-disk memory mappable chunks replay completed" duration=1.35262ms
ts=2022-04-18T08:29:02.333Z caller=head.go:542 level=info component=tsdb msg="Replaying WAL, this may take a while"
ts=2022-04-18T08:29:02.501Z caller=head.go:578 level=info component=tsdb msg="WAL checkpoint loaded"
ts=2022-04-18T08:29:02.538Z caller=head.go:613 level=info component=tsdb msg="WAL segment loaded" segment=26 maxSegment=31
ts=2022-04-18T08:29:02.560Z caller=head.go:613 level=info component=tsdb msg="WAL segment loaded" segment=27 maxSegment=31
ts=2022-04-18T08:29:02.574Z caller=head.go:613 level=info component=tsdb msg="WAL segment loaded" segment=28 maxSegment=31
ts=2022-04-18T08:29:02.584Z caller=head.go:613 level=info component=tsdb msg="WAL segment loaded" segment=29 maxSegment=31
ts=2022-04-18T08:29:02.612Z caller=head.go:613 level=info component=tsdb msg="WAL segment loaded" segment=30 maxSegment=31
ts=2022-04-18T08:29:02.613Z caller=head.go:613 level=info component=tsdb msg="WAL segment loaded" segment=31 maxSegment=31
ts=2022-04-18T08:29:02.613Z caller=head.go:619 level=info component=tsdb msg="WAL replay completed" checkpoint_replay_duration=167.400695ms wal_replay_duration=111.76775ms total_replay_duration=280.558839ms
ts=2022-04-18T08:29:02.614Z caller=main.go:958 level=info fs_type=EXT4_SUPER_MAGIC
ts=2022-04-18T08:29:02.614Z caller=main.go:961 level=info msg="TSDB started"
ts=2022-04-18T08:29:02.614Z caller=main.go:1142 level=info msg="Loading configuration file" filename=/etc/prometheus/prometheus.yml
ts=2022-04-18T08:29:02.614Z caller=main.go:1179 level=info msg="Completed loading of configuration file" filename=/etc/prometheus/prometheus.yml totalDuration=456.354µs db_storage=645ns remote_storage=1.253µs web_handler=620ns query_engine=615ns scrape=176.773µs scrape_sd=39.083µs notify=1.018µs notify_sd=1.114µs rules=850ns tracing=2.874µs
ts=2022-04-18T08:29:02.614Z caller=main.go:910 level=info msg="Server is ready to receive web requests."
@theCalcaholic any solution for this issue? I’ve already tried testing the approaches in this thread (incl. checking if Prometheus source is found in Grafana; docker-compose down, pull, rm and up again)
Additionally, it seems that the metric endpoints show the data correctly, however in the Prometheus UI I cannot find ncp tagged metrics… is this by design or is the issue somewhere in here?
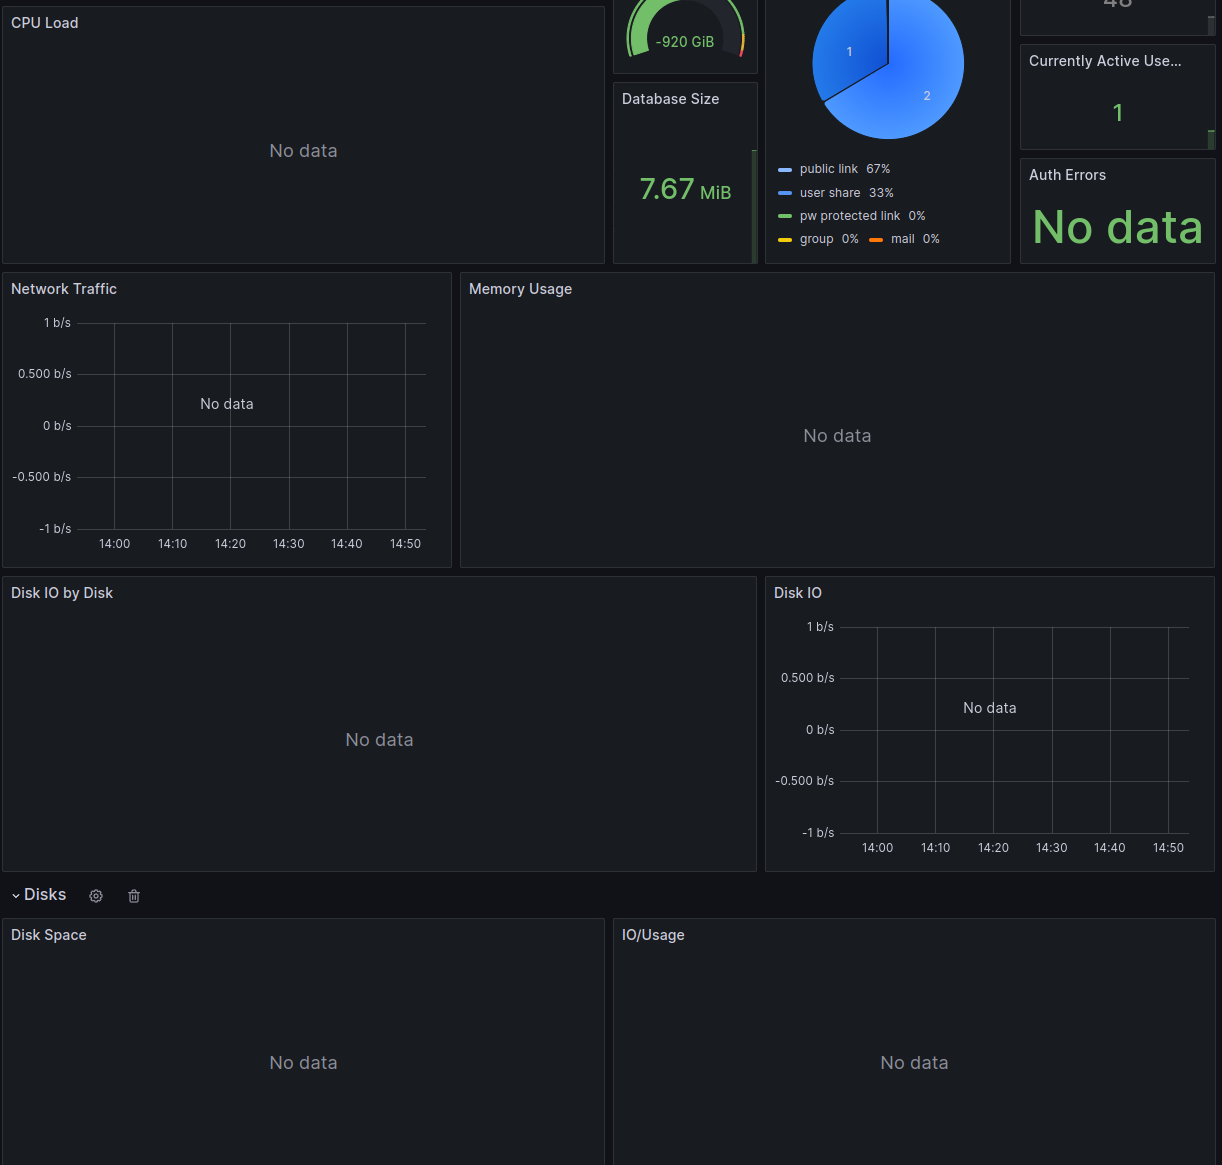
I’m using NCP version 1.52.4 on a Raspberry Pi 4 with Nextcloud version 26.0.3.2. The setup script worked flawlessly on my Ubuntu 23.04 desktop. However, I can’t see any HW-related stats in the Grafana dashboard. That include CPU Load, Network traffic, Memory usage, Disk IO, Disk IO by Disk and the whole ‘Disk’ panel category.
P.S.: I’ve setup an Android app called RaspController which delivers HW statistics on the Raspberry Pi… not sure if this is interfering as @ZackSpeed_Jesus was also mentioning using another monitoring tool.