And you can download from the speed server quite ok. I’ve just seen that the loading of some resources either doesn’t work or timeout (especially avatars, either timeout or some take very long like 9s). Not sure if that adds up in a bad way with the increased delay that you obtain much more timeouts. Problem of these nice interactive pages lazy-loading (depending on how much you scroll) works very well for short delays but if the delays are increasing and you have problems, it can be very painful to use…
I’m not getting timeouts, everything does eventually load. The problem I’m having is it takes 1.7 minutes from initially starting to load the page to see anything on screen. I had to wait that long to open this up to write the reply (I timed it). Once everything’s loaded it’s more usable, if a bit slow. For example I don’t get an exceptionally long delay posting replies and I can navigate around the forums without too much delay.
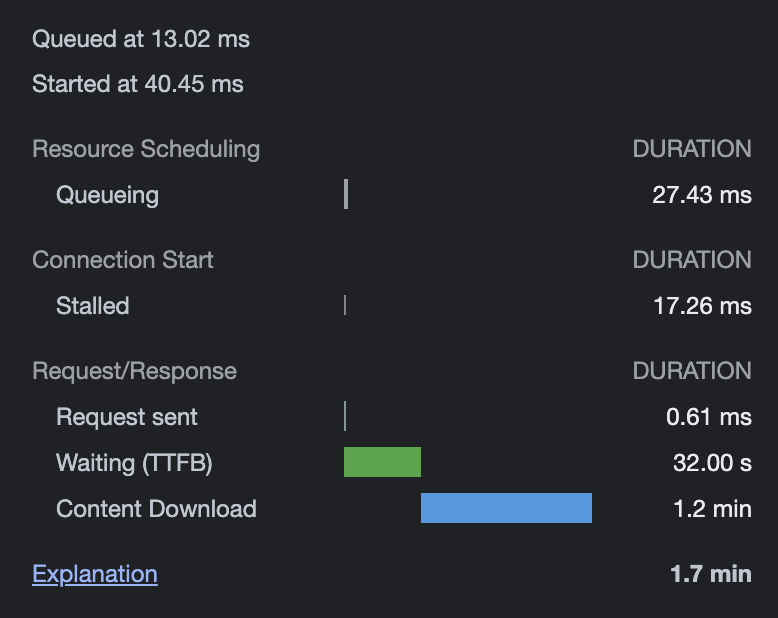
I looked in the browser’s network inspector to see if there was anything specific causing a problem, but it’s basically every resource taking a very long time to load. For example, this resource:
This seems to be consistent, in that in curl it always takes around 2 seconds and in my browser (I’ve tried several different machines and browsers) it always takes just under 2 minutes. Maybe there’s some kind of cumulative effect happening?
By comparison, the link you posted takes around 5 or so seconds to fully load, which is a little slow, but it’s still usable.
I’m also seeing consistently slow (first view/cold cache) page load times for help.nextcloud.com. Over a minute to be able to see and do anything. Similar results in both Firefox and Chromium.
I’m really confused why I can’t reproduce the problem using www.webpagetest.org. Timings from that site are consistently and reasonably fast enough, say, 5 seconds or less. So I’m trying to isolate what might be different between www.webpagetest.org and my home network. One difference is DNS.
I thought perhaps when stats.nextcloud.com is blocked it slows down the help.nextcloud.com user experience. At home I am usually blocking stats.nextcloud.com using a Pi-hole. This uses a DNS trick so stats.nextcloud.com resolves to 0.0.0.0. With the DNS block in place, it takes minutes for the first/cold page load of https://help.nextcloud.com. But when I allow proper DNS resolution for the stats.nextcloud.com domain it seems to take just as long.
It works quickly on my mobile phone web browser when I am not on my home network (and not behind my Pi-hole), though.
I think we really need help working through a browser-side performance profile showing each URL, which ones take a long time, and especially looking for anything that blocks. Anyone have experience doing this? I can definitely see some scripts taking a long time when I’m using Firefox Developer Tools but I’m having trouble sharing the result.
I also tried the curl timing examples others mentioned (very cool, thank you!) but the results are intermittent. One time an avatar placeholder image will take 2 minutes to fetch, then another time it’ll take 2 seconds.
I am from India. Here too the initial Help.NextCloud website webpage loading time is really really slow. Takes ages for the page to load but once loaded, it works relatively fine.
Here are my ping / trace route results.
C:\Windows\system32>ping help.nextcloud.com

Pinging help.nextcloud.com [95.217.53.146] with 32 bytes of data:
Reply from 95.217.53.146: bytes=32 time=197ms TTL=48
Reply from 95.217.53.146: bytes=32 time=198ms TTL=48
Reply from 95.217.53.146: bytes=32 time=198ms TTL=48
Reply from 95.217.53.146: bytes=32 time=197ms TTL=48

Ping statistics for 95.217.53.146:
    Packets: Sent = 4, Received = 4, Lost = 0 (0% loss),
Approximate round trip times in milli-seconds:
    Minimum = 197ms, Maximum = 198ms, Average = 197ms

C:\Windows\system32>tracert help.nextcloud.com

Tracing route to help.nextcloud.com [95.217.53.146]
over a maximum of 30 hops:

  1    <1 ms    <1 ms    <1 ms  192.168.1.1
  2     6 ms    16 ms    14 ms  xx.xxx.xxx.xxx
  3     *        *        *     Request timed out.
  4     3 ms     1 ms     1 ms  10.240.246.1
  5     3 ms     2 ms     3 ms  10.200.22.1
  6    34 ms    32 ms    32 ms  125.23.238.225
  7     *        *        *     Request timed out.
  8   188 ms   186 ms   188 ms  decix2-gw.hetzner.com [80.81.193.164]
  9   177 ms   181 ms   177 ms  core9.fra.hetzner.com [213.239.224.178]
 10   198 ms   198 ms   209 ms  core32.hel1.hetzner.com [213.239.224.169]
 11   206 ms   207 ms   226 ms  ex9k2.dc2.hel.hetzner.com [213.239.224.146]
 12   202 ms   200 ms   201 ms  s5.nextcloud.com [95.216.247.163]
 13   197 ms   197 ms   197 ms  help.nextcloud.com [95.217.53.146]

Trace complete.

C:\Windows\system32>
I was still seeing a few 500 errors this week, it was perhaps a bit worse two weeks ago.
The curl-test in my post above is still exactly the same. It’s just a bit above 60s, so I’m wondering if there is a timeout that is triggered after 60s.
Check out mtr (my traceroute). That tool shows me 85% packet loss from 4.68.38.173 (the 4th hop), and 0% packet loss from all others. I like to imagine that router is somewhere deep in the Atlantic ocean.
I’m in Australia and help.nextcloud.com has been slow as can be for years, I’ve more or less given up on hoping it would ever be better. The only reason I’m here, is today it’s slow beyond. My browser has been sitting on:
for literally hours. And trying it through a US proxy yields same result. The only way I get to post this at all, is on the TOR network (using the Tor Browser) where it’s merely very slow, but functional.
Nextcloud rocks, it really does, but how can it be the only service among the hundreds we all use that has a help site that is so non-performant? It’s quite hard to believe really.
Some improvement have been performed shortly. Please double check if logout and clear browser local data improves forum performance (try when not logged in/using private mode as well).
For me it did the trick - loading posts in new tab in firefox dropped from 5 sec to 1 sec…
I know about some DB optimization - but this should have no affect on web interface side…
it looks MTU is even lower than reported before
on Windows 10
ping help.nextcloud.com -f -l 1172 -n 1
works
ping help.nextcloud.com -f -l 1173 -n 1
fails
but IMHO it has no effect on “good” connections… I have VDSL2 account in CH with 100M+ with MTU 14xx+… and see almost no issues now… I’ not sure this is the reason for reported issues…
for me forum works faster since some days/weeks
UPDATE: the low MTU was a config error on my side (MTU 1200 remained active on my client after some troubleshooting). Effective MTU is always 28Bytes lower than MTU of my client - but I see no difference when I configure MTU 1200 and MTU 1480 - both values are fast enough now.
I was to post about this issue in a new thread but only to procrastinate post it here, yes, this website is hyper slow. It takes up to 5 minutes to load, and sometimes I have seen it takes more than 15 minutes to load any page. I have to use the Google cache to see what I need from this website.
If you still have problems, @daphne reaches out for users that still have issue. They already fixed issues that helped some people but they need feedback from users that still have issues.
@neoacevedo
Can you use the browser dev tools (F12) and there Network and post a screenshot. You can find details at entry 64 and an example at 65 of this thread
Something else to try: delete all browser cookies, cache, and local storage for help.nextcloud.com. I was experiencing slow loading in Firefox just now and it loaded very quickly after I did this.
And a huge thanks to you and @tflidd and @daphne for helping track this stuff down.
It means the forum is slow yet usable. That is, 5 to 10sec until the “load” event fires.
Your suggestion of clearing site data seems to relieve a problem that (intermittently) makes it take more than 5 minutes to load or timeout and sometimes never finishes loading.
I still have the other problem where download speeds for Javascript assets are slow over my home 1gpbs fiber connection–about 10KiB/sec. Some other folks have reproduced this but it’s an odd one. Does not repro over a mobile data connection. Luckily this slow download speed is only a problem when I try to use the forums with a completely cold cache, so, not too often. With a cold cache I’m waiting a few minutes until the “load” event fires.
Here’s another example of the slow download speeds:
$ curl --compressed -o /dev/null https://help.nextcloud.com/assets/discourse-12a807403b8f23c14a92099c4e078ddbbac432d1409edb731c4150ac17a7d55d.js
  % Total    % Received % Xferd  Average Speed   Time    Time     Time  Current
                                 Dload  Upload   Total   Spent    Left  Speed
 45  490k   45  224k    0     0   9163      0  0:00:54  0:00:25  0:00:29  9521
great you can use the forum now!
but the issue loading .js make me completely curious… my load times are sub-second on native Win 10 and even Debian VM running in hyper-v on my laptop…
sounds really weird… while this is a proof the forum “itself” works OK and the problem must be related to the provider: router/provider… I have no good idea how to troubleshoot further.
BTW: Few days ago I found something was wrong with Firefox - private window with “disable cache” check-mark tick never loaded… MS Edge worked fine… - today it’s “back to normal” - FF 107 loads the forum in a private window with cache disabled in ~3sec