A new version of the “Splunk App for Nextcloud” has been released, two new dashboards added. This app is the probably the most complete Nextcloud monitoring solution.
An installation guide can be downloaded here:
To access the Splunk, go to the Splunk App Store:
https://splunkbase.splunk.com/app/3398/
The Splunk app currently has the following dashboards:
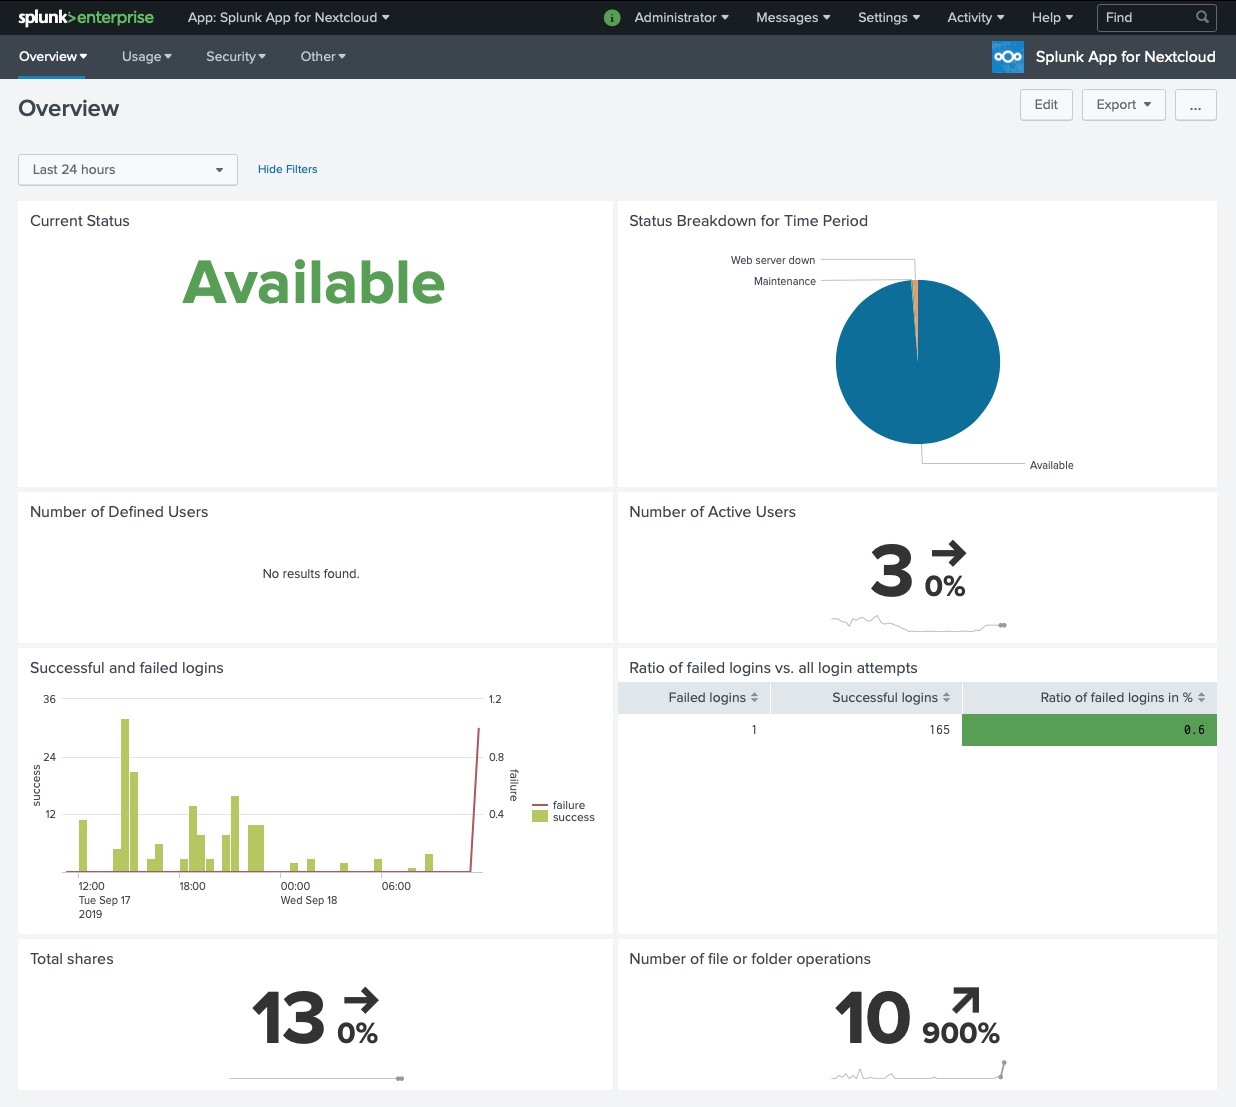
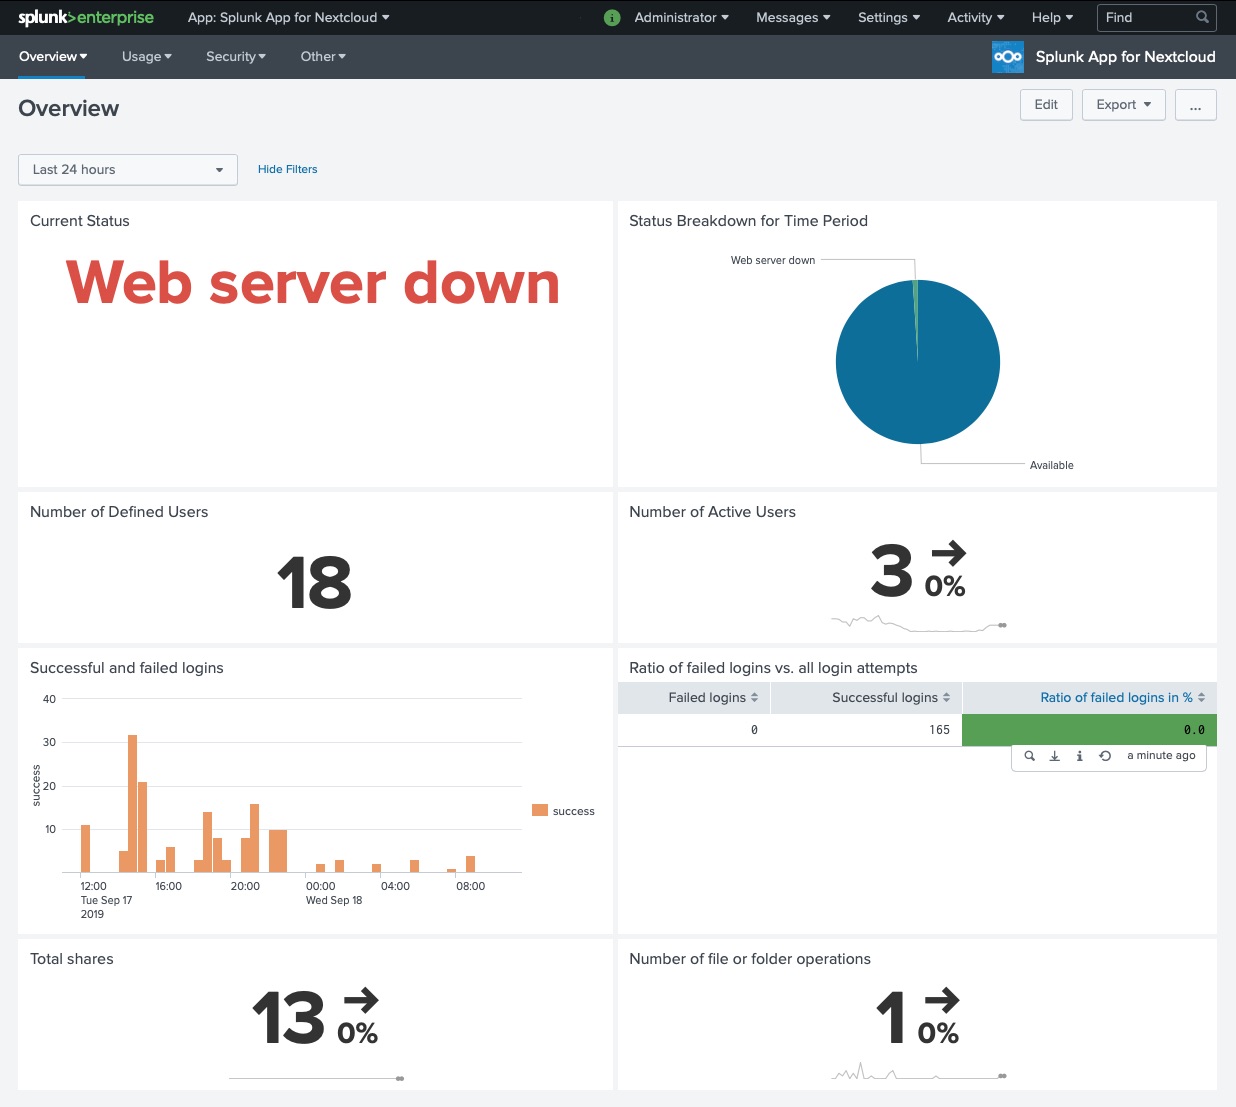
- Overview.
- Current status of the Nextcloud server (available, in maintenance, web server down, host unavailable).
- Status breakdown for time period.
- Successful and failed logins and ratio of the same.
- Number of defined and active users.
- Number of total shares and number of file operations.
- Nextcloud System Information.
- Information about current Nextcloud server configuration.
- Timeline of Nextcloud server upgrades.
- Users.
- Number of defined and active users.
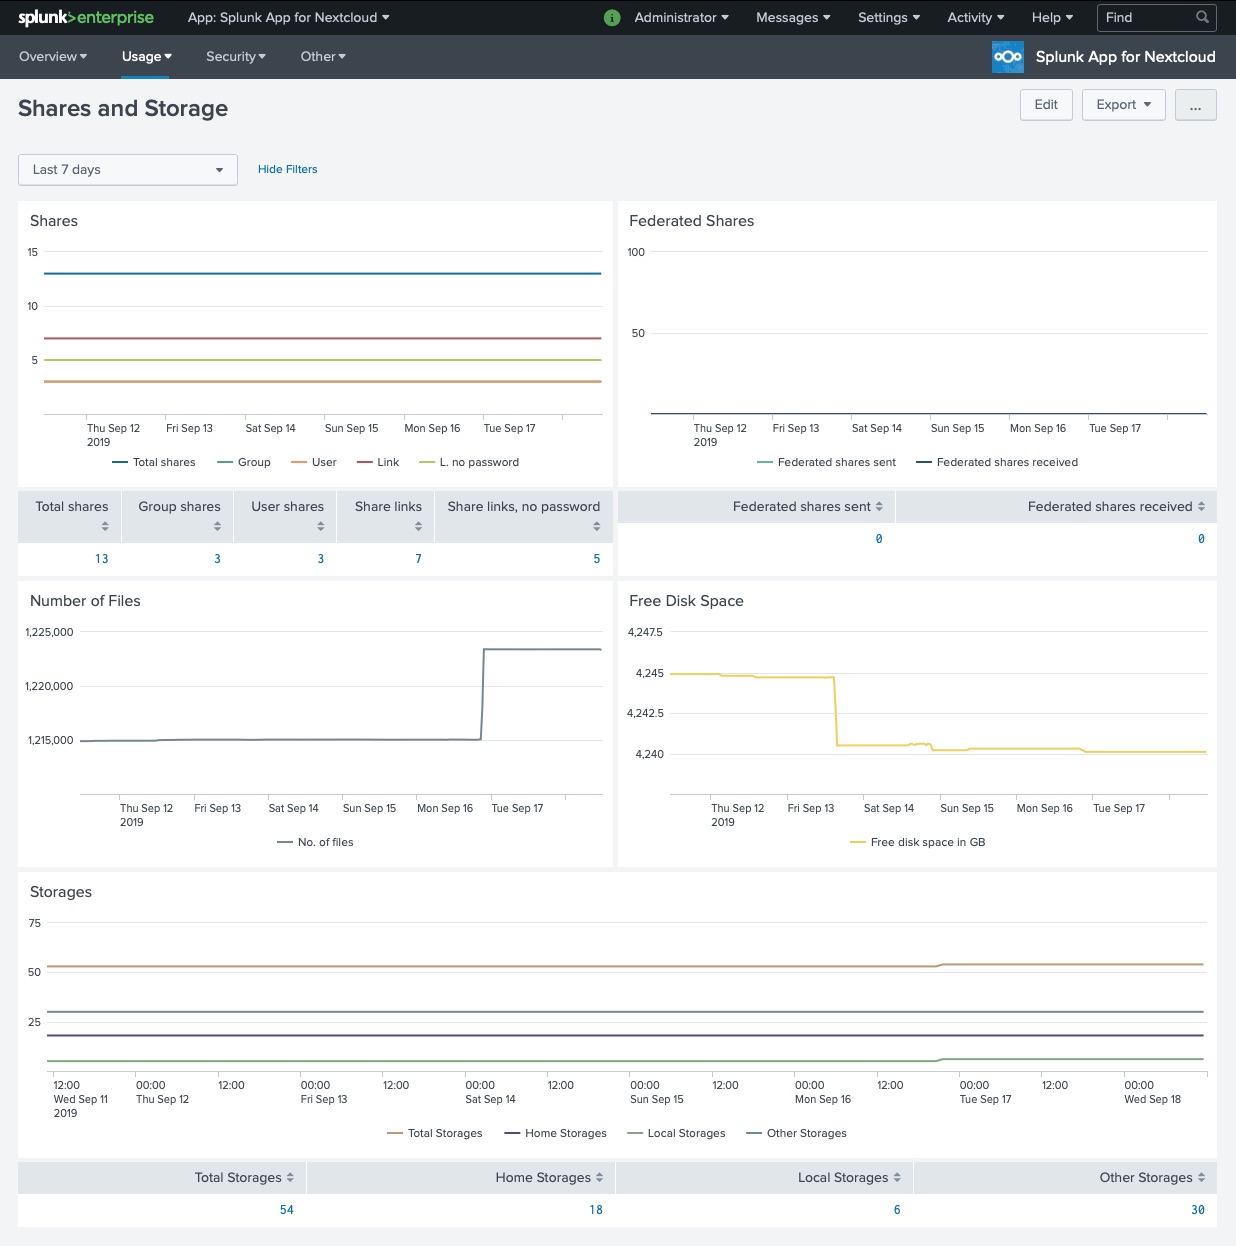
- Shares and Storage.
- Number of shares, federated shares, files and free disk space.
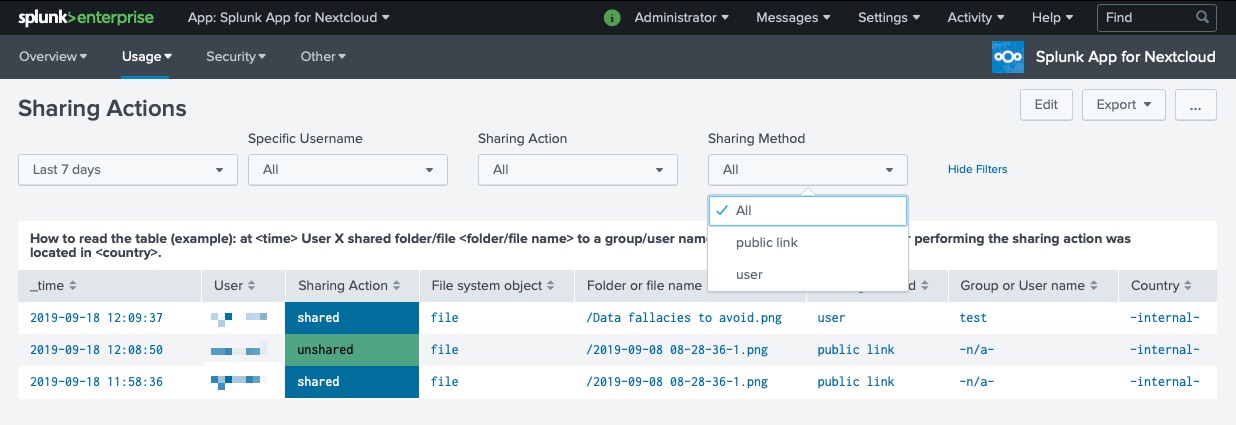
- Sharing actions.
- Who has shared (or unshared) what, with whom, how (public, user or group shares) and when.
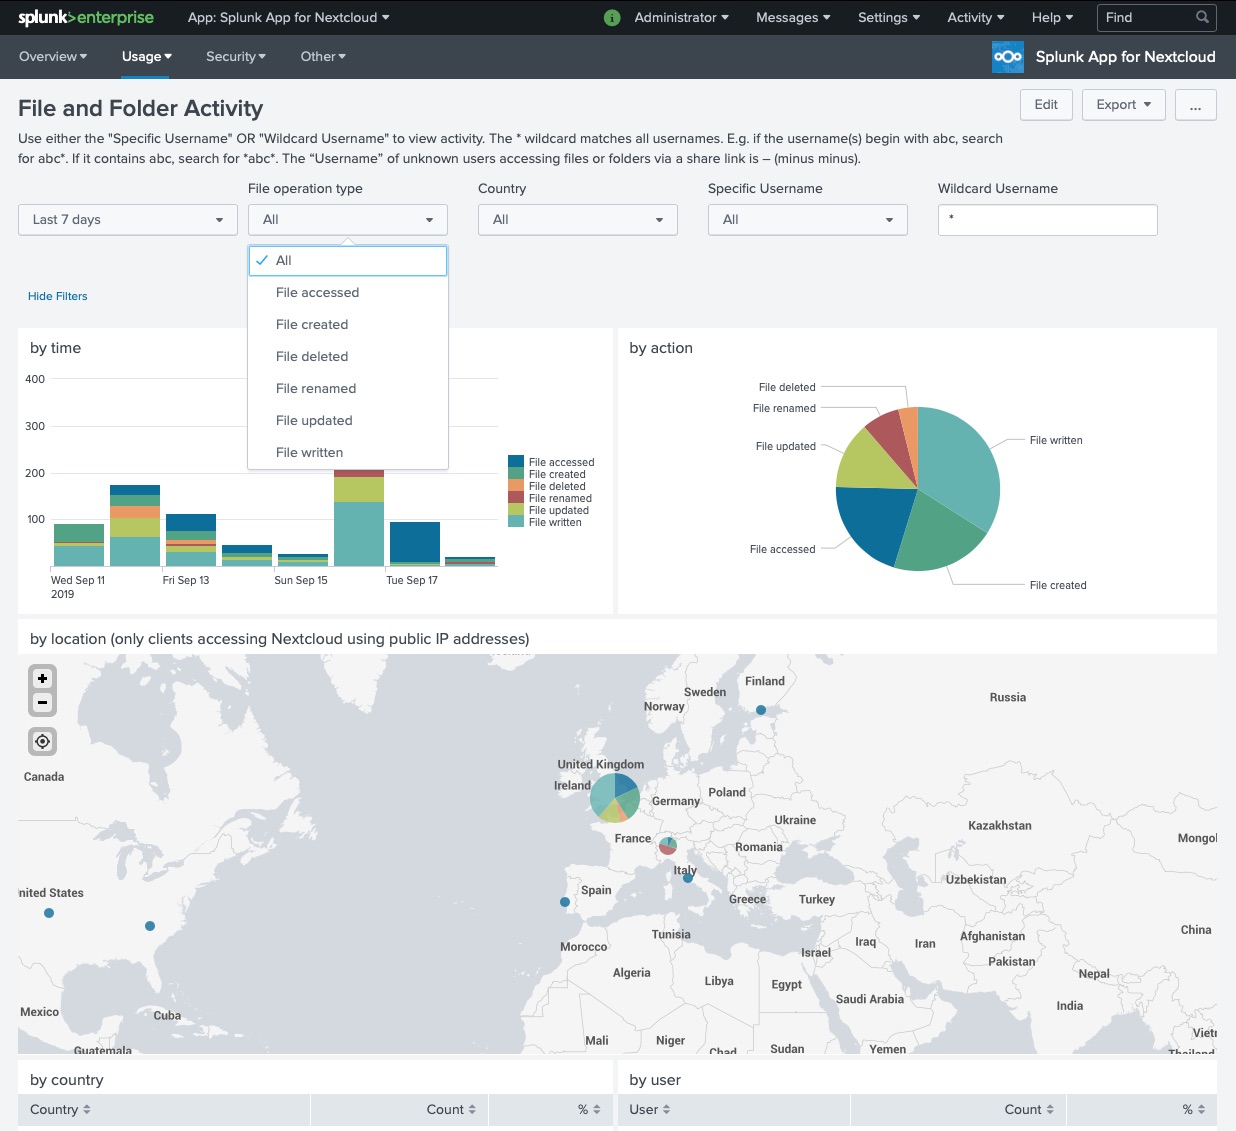
- File and Folder Activity.
- What file or folder operations have been performed by whom, when, from where. Ability to filter the file and folder activity by country and/or user.
- Public File Access.
- What has been accessed via public shares, when and from where.
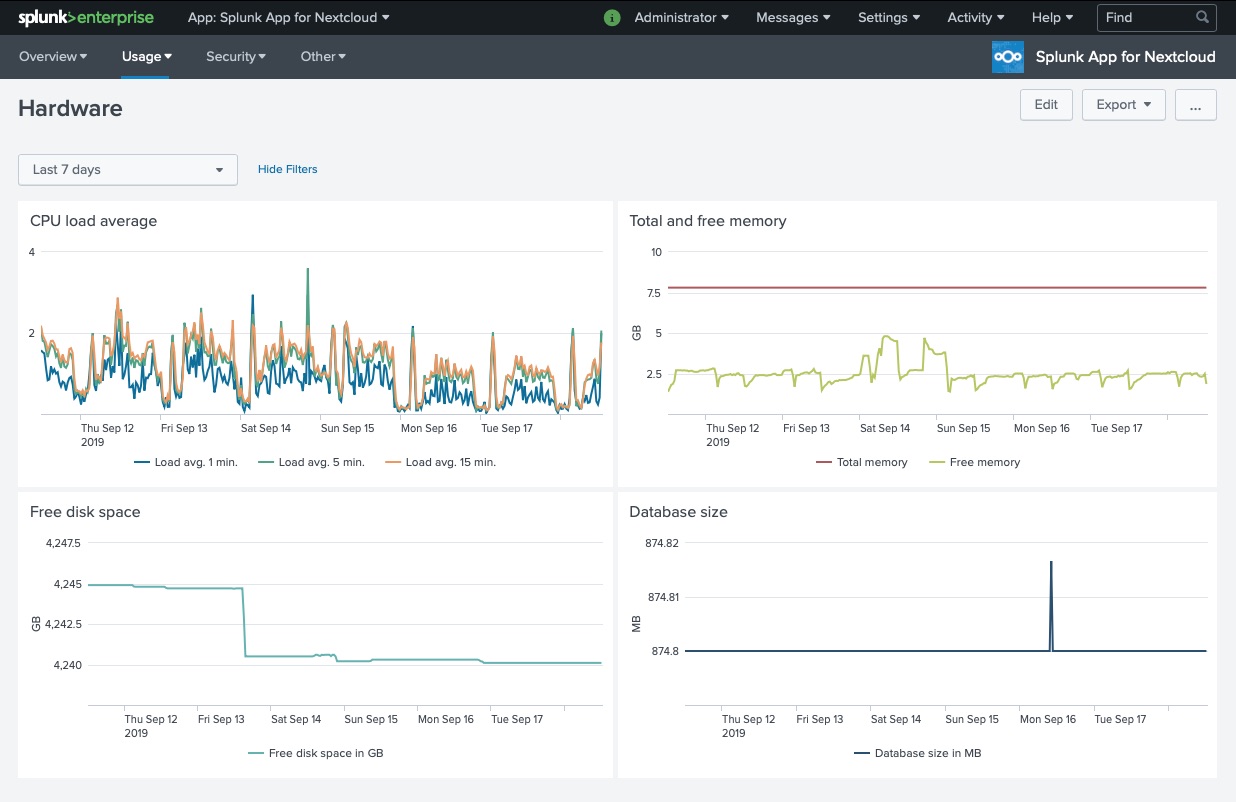
- Hardware information.
- CPU load averages, free and used memory, database size.
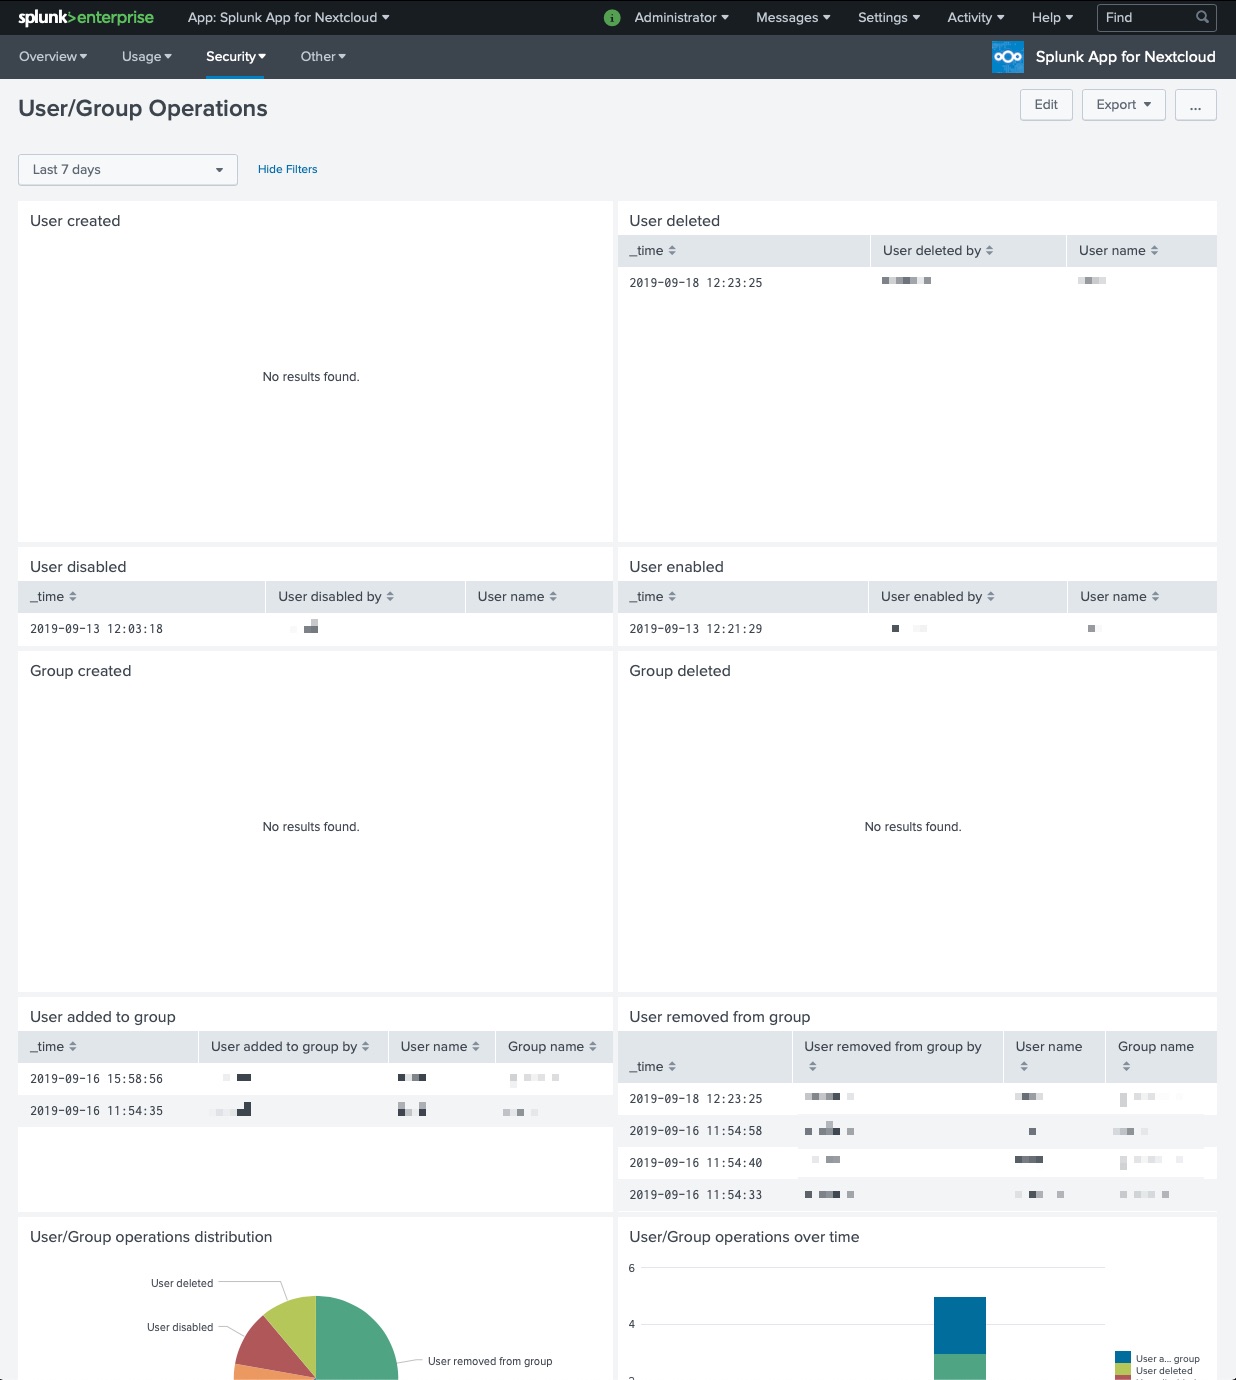
- User/Group Operations.
- When and by whom were users created or deleted, disabled or enabled, added or removed from groups, groups created or deleted.
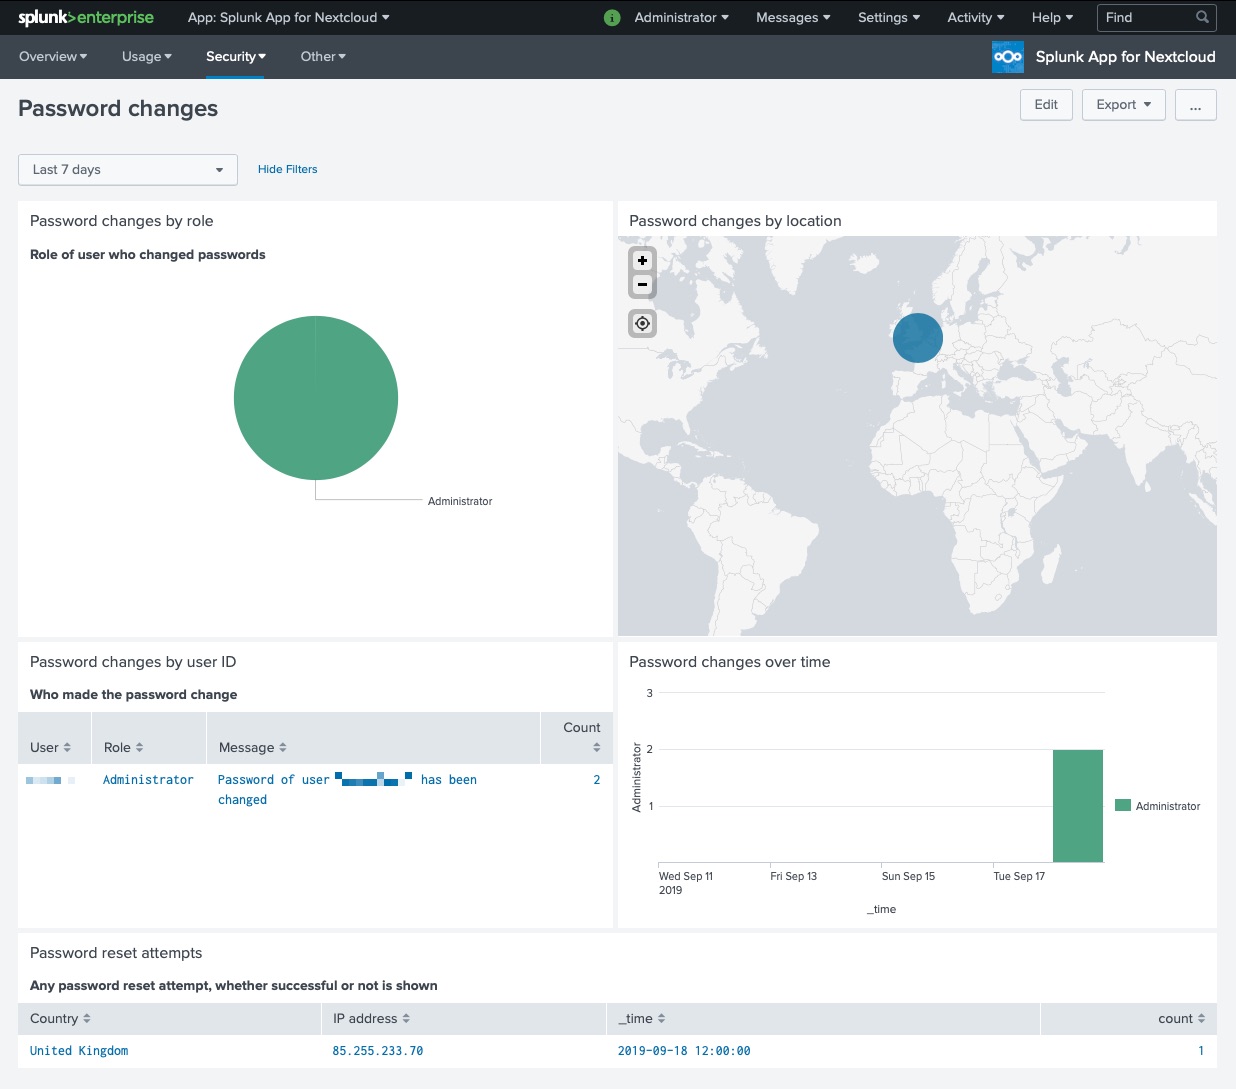
- Password Changes.
- Who has or have had had their password changed, who changed it and from where. What password reset attempts have there been.
- User Login Activity.
- Login activity over time and by location. Full login activity audit trail. Ability to filter the login activity by country and/or user.
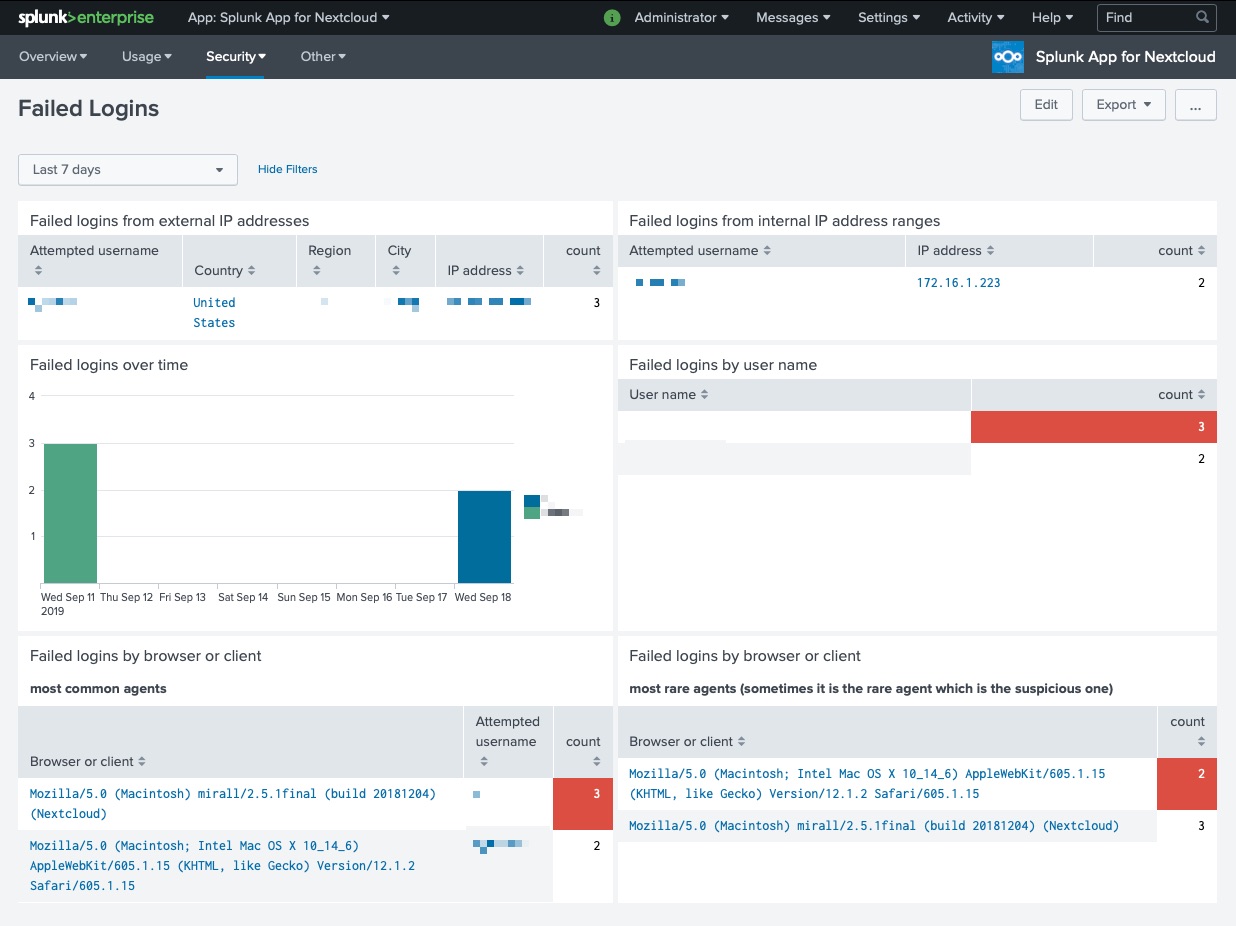
- Failed Logins.
- Failed logins shown from external and from internal IP addresses, over time and by user.
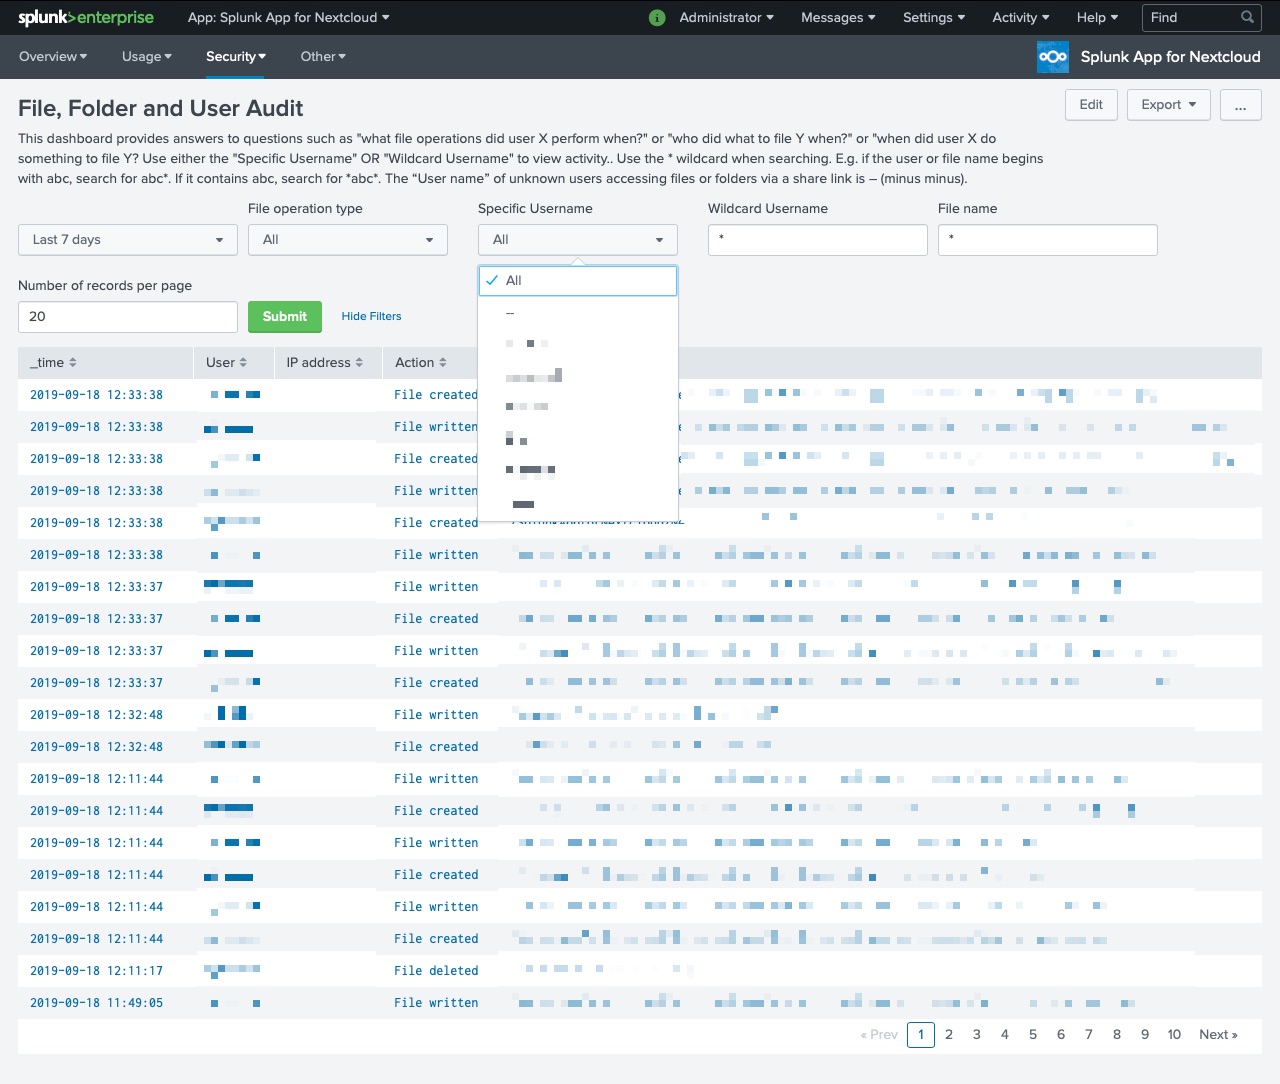
- File, Folder and User Audit.
- Complete file and folder audit trail providing answers to questions such as “what file operations did user X perform when?” or “who did what to file Y when?” or "when did user X do something to file Y?
- Virus Detection.
- Statistics and information from the “Anti-virus for files” app for Nextcloud.
that sounds quite good.
but why don’t you release it at official app-shop?
A slight misunderstanding, the app is for the Splunk platform, but monitors the Nextcloud platform, hence it is accessible from the Splunk App Store.
Hi there Rickenbacker.
I just created a new instance V23 and the failed log ins are not displaying ? Has Nextcloud moved the log or do the dashboard queries need updating ? All other dashboards are lighting up and I have added the path to audit.log and nextcloud.log.
Thanks in advance.
Is this still working? I just tried working through the installation, and it appears that everything installed correctly, but I get no data, and under troubleshooting, the last script run never populates. I even changed it to run every 1 minute to see.
Are there other options to visualize data? I really want something that allows me to audit shared downloads (IE: see who downloaded what, and when).
So I managed to get some things working. sorta. I moved Splunk to the same server and added the log files directly and set them to nextcloud-log source types.
I still can’t get the scripts to work, but they run just fine if I run them directly from the Linux CLI. The one thing the documentation didn’t mention when setting up the scripts is what to set the source-type to. Can someone confirm?
Also, when doing a file and folder audit, I get a list of users and files, but not what was actually done. The ‘File Action’ filter only has “File with” as a filter. I have tried modifying the actual drop down search string listed under dynamic to get accessed, created, etc, but nothing I do will work. Any change just makes nothing show up. Does anyone know of a way to get that information?
Hi Muzicman0,
I’m the original creator of the Nextcloud Splunk package which I created while I worked for Splunk. It is now 4 years since I left Splunk, and worked on the package. So although I created the package, I’m a bit rusty on how it works.
I’ll take a look at my documentation to remind myself later this week.
Specifically regarding the source type, as I recall, there is no need to set that manually.
The dashboards make use of information from the Nextcloud log files AND from the provided scripts. The information gathered from the scripts are not as interesting as the data gathered from the log files.
I still use Nextcloud myself, I don’t recall whether the Nextcloud log file formats changed enough that the Splunk dashboards I created no longer work. Unless something relevant in Splunk has changed, I don’t see why the dashboards wouldn’t work anymore.
I think the biggest change in the log files is that they now log file auditing as something like:
File with id “362” accessed: “/swittwer/files/Hiperwall Video Wall Software/2025 R1.x/HiperController 2025 R1.1 setup.exe”
which breaks the filter. You can only filter down to ‘File with’, which unfortunately is somewhat useless since you can’t filter to accessed, deleted, etc.
I was able to make my own table, but it is very basic. Would love it if the app could be updated, but I also understand that it’s your free time.