Nextcloud version: ‘Nextcloud Hub 3 (25.0.3)’
Operating system and version: ‘Ubuntu 22.04.1 LTS’
Apache or nginx version: ‘Apache/2.4.41 (Ubuntu)’
PHP version: ‘PHP 8.1.2-1ubuntu2.9 (cli)’
Hello, Trying to connect to my server. The server hangs for around 10-20 seconds and then is fine for about 30 seconds if i click through pages/files but then hangs again and this is on repeat.
Its not usable in this state. I dont think its anything to do with the network, its a simple network and all other endpoints on it work without issue. I can also ping this server with never a drop.
I dont think this is to do with cpu utilisation. I have upped the VM to 8 cores now. Memory is always about 50 percent utilized.
This issue wasn’t present on my ubuntu 20.04 which this is a restored backup from and issue has been here since.
Would this be database related? How would i know or what to check?
To me It sounds a bit like like memory issue or failing hard drives possibly…
Do you have enough memory dedicated to Nexcloud?
Remember that the absolute bare minimum memory requirement is 512M. But 1GB or more (Depending on how many users you have of course.), would be better…
Have you checked the health of your servers hard drives lately?
If they are in an unhealthy state then that could also make your server freeze up randomly.
my memory is 4gb and looking at the system page within NC its utilization is around 50 percent most of the time. I’m not sure how to work out the 512mb per process? How do I check how many processes i have? i have feeling that is a very novice question.
I am concerned about the storage drive. Its a brand new nve drive, but concerned the m2. drive slots are an issue on the board. However, other vm’s running on this drive don’t seem to have any issues. i think i will move the vm to another drive when space is available for to check this.
Is there any commands/tools i can run on the cli to check the drive health?
Not sure there is an issue according to the below, but maybe the esxi host cant tell? I dont know.
[root@*********i:~] esxcli storage core device smart get -d t10.NVMe____CT2000P3SSD8____________________________560000B06CA7796
4
Parameter Value Threshold Worst Raw
Health Status OK N/A N/A N/A
Power-on Hours 148 N/A N/A N/A
Power Cycle Count 2 N/A N/A N/A
Reallocated Sector Count 0 95 N/A N/A
Drive Temperature 33 85 N/A N/A
Write Sectors TOT Count 1201064000 N/A N/A N/A
Read Sectors TOT Count 309372000 N/A N/A N/A
I was planning on moving all my vm’s to this drive so will move the rest and if they show same issue, i will move this nc to a previous drive.
Well “DOA” is more a technical term that a product has serious flaws and should be replaced. It doesn’t imply directly that the product is stone cold dead.
It could very well be “working to some degree” , but not as expected.
In your case; its working, but maybe not really working and might be about to fail.
With that said; I could of course be dead wrong of course.
But that is also why I suggested that you test with another HDD so you can rule out if the problem persists or not with the server doing this lagging when you use the other drive.
If that is not the case then you at least will know that the hard drives are not an issue and there must be something else at play.
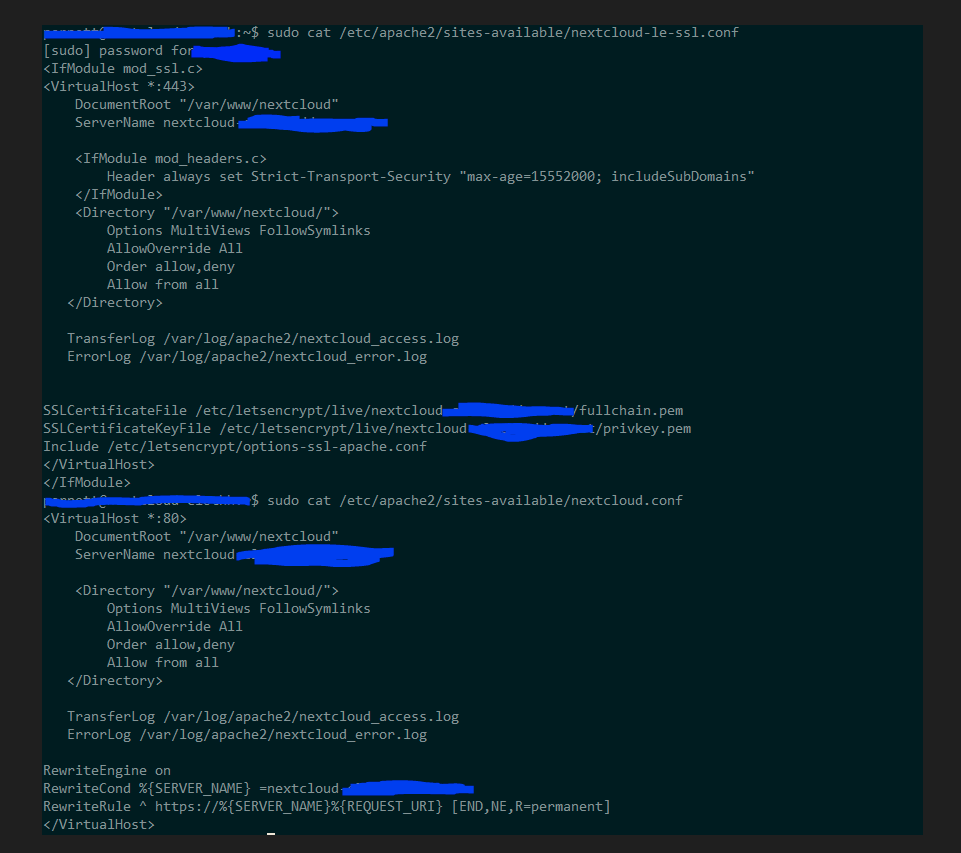
I moved the vm to another disk and its still the same. I think it must be to do with apache configuration as when i connect through web browser to the ip address, the unsecure warning page is instant, but clicking continue is when it hangs for about 10-20 seconds then gets to login screen, and this hang will keep repeating periodically.
Is this all the config associated with my ssl apache config? Can you see anything that could be an issue? screenshots to follow…
I never heard of a system lagging because of the Apache configuration. It must be something else. it’s good that you ruled out the hard drive. Now you know at least that isn’t that issue. Have you ran a memory test on the hardware server itself like memtest+86 or something similar.?
That could be also something that could make a machine lag like that.
today I was having the exact same issue, that was resolving by restarting php8.1-fpm service, but after a little while the issue return.
So checking the php8.1-fpm log, last line was
[pool www] server reached pm.max_children setting (5), consider raising it
Triyed adjusting below values in file /etc/php/8.1/fpm/pool.d/www.conf seems to work
this was REALLY helpful! I’ve found this solution after 8 hours of troubleshooting, strait night long. Symptoms were - all sites published on my server were unresponsive write after second participant joins the call. But Apache log didn’t show any useful information, at last I looked at php-fpm service log. Message was exact the same “server reached pm.max_children”