Nextcloud is inconsistently slow (30+sec loading time, or only 2)

Support intro

Sorry to hear you’re facing problems :slightly_frowning_face:

help.nextcloud.com is for home/non-enterprise users. If you’re running a business, paid support can be accessed via portal.nextcloud.com where we can ensure your business keeps running smoothly.

In order to help you as quickly as possible, before clicking Create Topic please provide as much of the below as you can. Feel free to use a pastebin service for logs, otherwise either indent short log examples with four spaces:

example

Or for longer, use three backticks above and below the code snippet:

longer
example
here

Some or all of the below information will be requested if it isn’t supplied; for fastest response please provide as much as you can :heart:

Nextcloud version (eg, 20.0.5): 24.0.6
Operating system and version (eg, Ubuntu 20.04): Ubuntu 20.04 (linux mint)
Apache or nginx version (eg, Apache 2.4.25): Apache 2.4.41
PHP version (eg, 7.4): 7.4.3

The issue you are facing:
Nextcloud was working fine, but then I moved. I did not change anything on the server, the only thing that has changed is the internet.
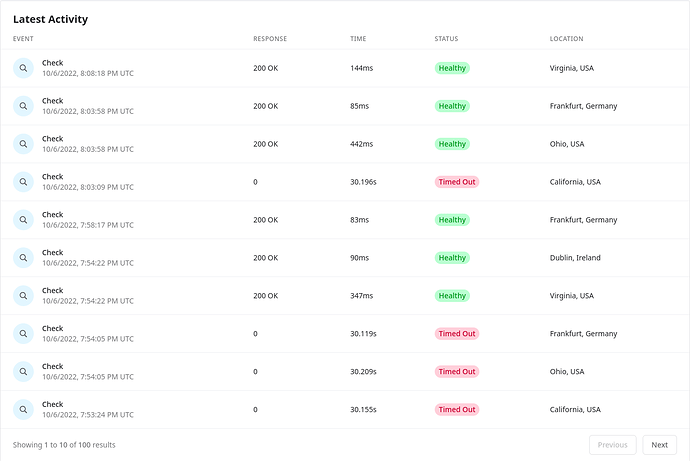
Now when I access the web interface, it’s a 50-50 guess if it’s gonna load or not. When it does, it loads in 2 seconds. When it does not, it takes 30+ seconds and then times out. You can see the inconsistency in the Cronitor HTTP monitor:


This is the case from both the local network, and the internet.

I usually have the traffic to Nextcloud outside my network proxied through Cloudflare but I turned that off now in order to diagnose.

Is this the first time you’ve seen this error? (Y/N): Y

Steps to replicate it:

  1. Move and get a different internet connection

The output of your Nextcloud log in Admin > Logging:

Info	updater	\OC\Updater::resetLogLevel: Reset log level to Warning(2)	
2022-10-06T20:21:28+0000
Info	updater	\OC\Updater::maintenanceDisabled: Turned off maintenance mode	
2022-10-06T20:21:28+0000
Info	updater	\OC\Updater::updateEnd: Update successful	
2022-10-06T20:21:28+0000
Info	updater	\OC\Updater::finishedCheckCodeIntegrity: Finished code integrity check	
2022-10-06T20:21:28+0000
Info	updater	\OC\Updater::startCheckCodeIntegrity: Starting code integrity check...	
2022-10-06T20:21:23+0000
Info	updater	\OC\Repair::step: Repair step: Add token cleanup job	
2022-10-06T20:21:23+0000
Info	no app in context	Deprecated event type for \OC\Repair::step: Symfony\Component\EventDispatcher\GenericEvent is used	
2022-10-06T20:21:23+0000
Info	updater	\OC\Repair::step: Repair step: Add background job to set the lookup server share state for users	
2022-10-06T20:21:23+0000
Info	no app in context	Deprecated event type for \OC\Repair::step: Symfony\Component\EventDispatcher\GenericEvent is used	
2022-10-06T20:21:23+0000
Info	updater	\OC\Repair::step: Repair step: Repair DAV shares	
2022-10-06T20:21:23+0000
Info	no app in context	Deprecated event type for \OC\Repair::step: Symfony\Component\EventDispatcher\GenericEvent is used	
2022-10-06T20:21:23+0000
Info	updater	\OC\Repair::step: Repair step: Queue a one-time job to check for user uploaded certificates	
2022-10-06T20:21:23+0000

The output of your config.php file in /path/to/nextcloud (make sure you remove any identifiable information!):

<?php
$CONFIG = array (
  'instanceid' => '***',
  'passwordsalt' => '***',
  'secret' => '***',
  'trusted_domains' => 
  array (
    0 => '*mydomain*',
  ),
  'datadirectory' => '/mnt/storage/nextcloud/data',
  'dbtype' => 'mysql',
  'version' => '24.0.6.1',
  'overwrite.cli.url' => 'https://*mydomain*',
  'dbname' => 'nextcloud',
  'dbhost' => 'localhost:3306',
  'dbport' => '',
  'dbtableprefix' => 'oc_',
  'mysql.utf8mb4' => true,
  'dbuser' => 'nc',
  'dbpassword' => '***',
  'installed' => true,
  'memcache.local' => '\\OC\\Memcache\\APCu',
  'loglevel' => 2,
  'default_phone_region' => 'NL',
  'mail_from_address' => 'noreply',
  'mail_smtpmode' => 'smtp',
  'mail_sendmailmode' => 'smtp',
  'mail_domain' => '***',
  'mail_smtpauthtype' => 'LOGIN',
  'mail_smtpauth' => 1,
  'mail_smtphost' => '***',
  'mail_smtpport' => '465',
  'mail_smtpname' => 'apikey',
  'mail_smtppassword' => '***',
  'mail_smtpsecure' => 'ssl',
  'twofactor_enforced' => 'true',
  'twofactor_enforced_groups' => 
  array (
  ),
  'twofactor_enforced_excluded_groups' => 
  array (
  ),
  'maintenance' => false,
  'theme' => '',
  'updater.secret' => '***',
);

The output of your Apache/nginx/system log in /var/log/____:

mydomain:443 192.168.1.177 - [user] [06/Oct/2022:22:33:41 +0200] "PROPFIND /remote.php/dav/files/[user]/ HTTP/1.1" 207 8286 "-" "Mozilla/5.0 (Linux) mirall/3.5.4git (Nextcloud, manjaro-5.18.19-3-MANJARO ClientArchitecture: x86_64 OsArchitecture: x86_64)"
kopia.kaas:80 ::1 - - [06/Oct/2022:22:33:47 +0200] "OPTIONS * HTTP/1.0" 200 136 "-" "Apache/2.4.41 (Ubuntu) OpenSSL/1.1.1f (internal dummy connection)"
mydomain:443 192.168.1.177 - [user] [06/Oct/2022:22:33:48 +0200] "GET /ocs/v2.php/apps/notifications/api/v2/notifications?format=json HTTP/1.1" 304 4897 "-" "Mozilla/5.0 (Linux) mirall/3.5.4git (Nextcloud, manjaro-5.18.19-3-MANJARO ClientArchitecture: x86_64 OsArchitecture: x86_64)"
mydomain:443 192.168.1.177 - [user] [06/Oct/2022:22:34:18 +0200] "PROPFIND /remote.php/dav/files/[user]/Downloads HTTP/1.1" 207 5755 "-" "Mozilla/5.0 (Linux) mirall/3.5.4git (Nextcloud, manjaro-5.18.19-3-MANJARO ClientArchitecture: x86_64 OsArchitecture: x86_64)"
mydomain:443 192.168.1.177 - [user] [06/Oct/2022:22:34:33 +0200] "PROPFIND /remote.php/dav/files/[user]/ HTTP/1.1" 207 1127 "-" "Mozilla/5.0 (Linux) mirall/3.5.4git (Nextcloud, manjaro-5.18.19-3-MANJARO ClientArchitecture: x86_64 OsArchitecture: x86_64)"
mydomain:443 192.168.1.177 - - [06/Oct/2022:22:33:50 +0200] "GET /index.php/login?redirect_url=/index.php/login/challenge/totp?redirect_url%3D/index.php/apps/dashboard/ HTTP/1.1" 200 13091 "-" "Mozilla/5.0 (X11; Linux x86_64) AppleWebKit/537.36 (KHTML, like Gecko) Chrome/105.0.0.0 Safari/537.36"
mydomain:443 192.168.1.177 - - [06/Oct/2022:22:34:35 +0200] "GET /index.php/apps/theming/favicon?v=3 HTTP/1.1" 304 299 "-" "Mozilla/5.0 (X11; Linux x86_64) AppleWebKit/537.36 (KHTML, like Gecko) Chrome/105.0.0.0 Safari/537.36"
mydomain:443 3.252.167.179 - - [06/Oct/2022:22:33:53 +0200] "GET / HTTP/1.1" 302 6234 "-" "Monibot"

Output errors in nextcloud.log in /var/www/ or as admin user in top right menu, filtering for errors. Use a pastebin service if necessary.

No errors. Only messages about the update I did 10 mins ago and cron messages.
What are your actual server specs? What kind of hardware?

  • CPU type
    • arm64 or x86-64
    • are you using a Raspberry Pi? If so, it supplies only the bare minimum specs as of Model 4.
  • How much RAM
    • If less than 4gb ram by itself, that is horrible.
  • How fast is your network speed?
    • If only xx mb/s of speed, you are hurting.
    • Please do not run your server over wifi. Very very slow.
    • Upgrade your network to wired gigabit if you can. Will greatly increase speeds.
    • External networking speeds will be hampered by your actual ISP speeds.
  • What kind of disks?
    • Spinning sata is fair
    • USB 2.0 external spinning drive garbage
    • Micro-SD card garbage
    • eMMC is not good
    • USB 3.0 external drive is fair for light usage
    • nvme Good!
    • SSD Good!
  • How many users?
  • Are you using one of the office suites?
    • Collabora CODE, OnlyOffice, etc?
    • If so, less than an additional two cores and additional 4gb ram is horrible.
  • Are you running other services on the same machine?
    • Matrix, Jellyfin, Jitsi, ?
    • If yes, you’ll need even more ram, etc.

Well, the weird thing is that it used to work fine on this system.

CPU is x86-64, quad core (Ryzen 2200G)
RAM: 8 GB of which 6 is usable by the system (2 GB probably for the GPU)
Old internet connection was 350 mbps down and 35 mbps up. At the new place I have 1gbps up and down and really low latency. Local network has always been 1gbps. I’ve never used wifi on this system
I have a 256GB sata drive as boot drive and 1TB nvme as mass storage (I added the 1TB drive later, it came from an older system so that’s why the boot drive isn’t nvme)
I’m the only user
I have both collabora and onlyoffice running but I of course don’t actively use them at the same time
I am running more services but I don’t think that’s an issue because memory and cpu usage are low:

Hi!
Maybe you have a network issue.
To discard network issues, you can track them using tools like MTR. Some network routes can be tricky some times, and, if you have console access to both sides, you can diagnose where the route is failling.
HERE there is a short guide of how to diagnose a route.
Take special attention to MTR output. %Loss can tell you why you have timeouts in your monitoring tool.
To solve your issues (if %loss are high), you can ask your network provider to check your routes, or, if there is not a posible solution, increase the timeout values.

1 Like

I’m a bit confused about the output.
Traceroute shows the following (I have a local DNS server so it resolves to the local IP):

$ traceroute mydomain
traceroute to mydomain (192.168.1.218), 30 hops max, 60 byte packets
 1  * * *
 2  * * *
 3  * * *
 4  * * *
 5  * * *
 6  * * *
 7  * * *
 8  * * *
 9  * * *
10  * * *
11  * * *
12  * * *
13  * * *
14  * * *
15  * * *
16  * * *
17  * * *
18  * * *
19  * * *
20  * * *
21  * * *
22  * * *
23  * * *
24  * * *
25  * * *
26  * * *
27  * * *
28  * * *
29  * * *
30  * * *

So this would mean that there are more than 30 hops? But this is on my local network, shouldn’t it be two hops (PC->router, router->server)

I did some more digging and traceroute does show the correct amount of hops with actual information (not ***) when I do not use the local DNS server and traceroute to the public IP (but the problem with nextcloud is both in and outside the local network)

MTR shows 0% loss:

                                      My traceroute  [v0.95]
[pc hostname] (192.168.1.177) -> mydomain (192.168.1.218)                 2022-10-07T16:31:27+0200
Keys:  Help   Display mode   Restart statistics   Order of fields   quit
                                                          Packets               Pings
 Host                                                   Loss%   Snt   Last   Avg  Best  Wrst StDev
 1. [server hostname]                                    0.0%   233    0.1   0.1   0.1   0.8   0.1

You probably need more ram and cpu. Nextcloud, onlyoffice and collabora will easily use all of it + more services… probably jellyfin or plex.

Try checking your actual system use to confirm. Start with top.

Any chance you have a LAN IP conflict? Can you still ping it while the web interface is timing out?

Traceroute try to grab route names, but, if you set ICMP protocol blocked in your network, it ends showing endeless unidentified hops. Allow ICMP packets in your network (it’s harmless)
MTR need to be executed both sides of the route (one side in server mode via -s param) and then you can do the inverse test to (switching client-server commands)

In this case, we assume resources are not the issue. Even, network test can be done regardless the resources in the hosts/clients. Here, look more like something interfering with the network traffic than a resource issue.

Maybe you have a good point! When, in your local network, two hosts grab the same ip address, it generates conflicts in the routes. Are you sure, @Kaassouffle, there is no conflict in your local network setup?

That would actually be a conflict in ARP. He said this is also happening with access via LAN, so I doubt he has a routing problem.

I don’t think RAM and CPU are a problem, see the htop screenshot I sent earlier.

For some context: I’ve connected my router to the local network of the university using the WAN port. Then, I have my own subnet 192.168.1.0/24.
There is no IP conflict I believe, when I unplug the server and ping the server’s IP address, I don’t get a response.
Also, the router definitely has a unique IP (you have to register the MAC of network devices with the university). Then I assume the port forwarded connection won’t leave my local network. So when accessing from outside the network, there is definitely no IP conflict and the issue is also there when accessing from outside the network.

IMCP isn’t blocked, because I can ping.

University networks uses to have a cache in the middle (like squid) to improve the whole performance. Maybe you are hitting it (so, sometimes cached content shows up in 2 secs, and when cached content is not available, jumps to +30 secs)
To clarify (correct me if i’m wrong) you set up your server behind your router and your router is behind the university provided connection?

can you confirm subnet mask and gateway settings for both the PC and the server?

how about traceroute from PC to router and server to router?

@coyotenq That is correct. It’s the setup the university recommends.
@copenhaus I checked and subnet mask and gateway are set correctly
It’s a bit weird. Traceroute from PC to router - or any other device on my network other than the server - shows 1 hop. This is also the case from server to any other device including my PC.
Traceroute from any device (I tested my laptop and PC) on my network to the server shows 30+ unknown hops

Definitely, the firewall in the gateway of your university is blocking some traffic (traceroute output shows that)
Let me show a similar situation:

traceroute to 54.39.xx.xxx (54.39.xx.xxx), 30 hops max, 60 byte packets
 1  198.245.53.1 (198.245.53.1)  0.558 ms  0.572 ms  0.551 ms
 2  192.168.143.254 (192.168.143.254)  0.537 ms  0.533 ms  0.522 ms
 3  158.69.47.126 (158.69.47.126)  0.509 ms  0.489 ms  0.471 ms
 4  po114.bhs-z2g2-a75.qc.ca (158.69.47.183)  0.478 ms  0.461 ms  0.448 ms
 5  be121.bhs-d1-a75.qc.ca (178.32.135.216)  0.437 ms  0.430 ms be120.bhs-d2-a75.qc.ca (198.27.73.60)  0.408 ms
 6  10.74.8.175 (10.74.8.175)  0.721 ms  0.514 ms 10.74.8.129 (10.74.8.129)  0.680 ms
 7  10.34.97.13 (10.34.97.13)  0.341 ms  0.324 ms 10.34.97.9 (10.34.97.9)  0.314 ms
 8  10.161.129.87 (10.161.129.87)  0.569 ms  0.701 ms  0.832 ms
 9  * * *
10  * * *
11  * * *
12  * * *
13  * * *
14  * * *
15  * * *
16  * * *
17  * * *
18  * * *
19  * * *
20  * * *
21  * * *
22  * * *
23  * * *
24  * * *
25  * * *
26  * * *
27  * * *
28  * * *
29  * * *
30  * * *

So, in the 8 hop, there is a firewall that “cuts” all the diag traffic. In your case, looks like the “heavy” firewall is in the first hop. This indicates (and it’s normal) that there is an active filter in the path.
IMHO, looks like the traffic its heavy reshaped in this firewall (and it’s okay too, in shared network setup like your university one, it’s a way to manage a gateway)
For sure there must be some kind of cache in the middle too.
All this combination, generates this effect (as i say before, hitting a cache shows a content in secs, and no hitting it can delay it a lot until cache is refilled)
Sadly, this is one thing you can’t control. You can ask to your network admins to provide a direct tunneling from one public IP to your router (so, no cache, filters, shaping, etc be applied to your traffic)

But wouldn’t the first ip in the traceroute be my own gateway (router)? And it shouldn’t hit the cache when I’m connecting to the local ip that the router gave it, since the connection doesn’t leave my own local network?
I also talked to the IT department and they say that they don’t block anything. There’s not even a NAT, my router has its own public ip. I’ll ask if there is some kind of cache.

Yep, the first hop must be your gateway, and the rest are part of the full route.

This is the weird part. Looks like your trace never leaves your local network. This can happen if you give to your router a FQDN name and trace against it. Is this the case?

Ok, lets assume there is nothing interfering in the middle.

can you provide the output of (gonna trace your route to the main google public dns server)?

traceroute 8.8.8.8

Sorry for the late reply, I was really busy the last couple of days.
Output of the traceroute:

$ traceroute 8.8.8.8
traceroute to 8.8.8.8 (8.8.8.8), 30 hops max, 60 byte packets
 1  _gateway (192.168.1.1)  0.386 ms  0.375 ms  1.079 ms
 2  sylvester-campus.routing.utwente.nl (130.89.160.4)  1.107 ms  1.155 ms  1.101 ms
 3  130.89.254.186 (130.89.254.186)  4.242 ms  4.215 ms  4.240 ms
 4  bdr1-tee-to-cr1-tee.routing.utwente.nl (130.89.254.7)  1.337 ms  1.598 ms  1.602 ms
 5  e0-0-3-0.es001a-jnx-01.surf.net (145.145.4.41)  1.347 ms  1.296 ms  1.302 ms
 6  ae23.nm001a-jnx-01.surf.net (145.145.176.55)  4.445 ms  3.958 ms  4.004 ms
 7  ae25.zl001a-jnx-01.surf.net (145.145.176.60)  22.038 ms  22.090 ms  22.007 ms
 8  lo0-2.asd001b-jnx-01-surfinternet.surf.net (145.145.128.4)  4.746 ms  4.807 ms  4.873 ms
 9  74.125.51.222 (74.125.51.222)  4.374 ms  3.997 ms  4.068 ms
10  108.170.241.129 (108.170.241.129)  3.991 ms 108.170.241.161 (108.170.241.161)  5.665 ms  5.257 ms
11  142.250.224.131 (142.250.224.131)  5.494 ms 142.251.225.137 (142.251.225.137)  4.584 ms 142.251.66.239 (142.251.66.239)  4.451 ms
12  dns.google (8.8.8.8)  5.135 ms  4.096 ms  3.599 ms

If it wasn’t clear, I’m testing on my local network. The requests shouldn’t leave the network, I have a custom DNS server with my domain linked to the local IP. However, the inconsistent loading times happen both on the local network, and when I connect from outside the network.

I also discovered that traceroute doesn’t work because of the firewall on the server. When I use -I (which uses ICMP ECHO for probes) , or disable the firewall, traceroute shows one hop, directly to the server.

Ok, this part is important. On your local network, the response time must be best, always.
The probabilities of having a defective hardware in your local network (a bad network wire or an ethernet interface failling ie) are low, but first of all, to discard this, with your terminal in the same lan than the server, do a traffic test with IPERF3 between both parts (IPERF3 can be started as server with -s option in command line)
If there is no failure, you have to get full sustained transfer rate (its a short test)
Example output
SERVER SIDE

iperf3 -s -p 1921
-----------------------------------------------------------
Server listening on 1921
-----------------------------------------------------------
Accepted connection from 10.0.0.7, port 57846
[  5] local 10.0.0.252 port 1921 connected to 10.0.0.7 port 57856
[ ID] Interval           Transfer     Bitrate
[  5]   0.00-1.00   sec  10.8 MBytes  90.2 Mbits/sec                  
[  5]   1.00-2.00   sec  11.2 MBytes  94.1 Mbits/sec                  
[  5]   2.00-3.00   sec  11.2 MBytes  94.0 Mbits/sec                  
[  5]   3.00-4.00   sec  11.2 MBytes  94.0 Mbits/sec                  
[  5]   4.00-5.00   sec  11.2 MBytes  94.1 Mbits/sec                  
[  5]   5.00-6.00   sec  11.2 MBytes  94.0 Mbits/sec                  
[  5]   6.00-7.00   sec  11.2 MBytes  94.0 Mbits/sec                  
[  5]   7.00-8.00   sec  11.2 MBytes  94.1 Mbits/sec                  
[  5]   8.00-9.00   sec  11.2 MBytes  94.0 Mbits/sec                  
[  5]   9.00-10.00  sec  11.2 MBytes  94.0 Mbits/sec                  
[  5]  10.00-10.04  sec   418 KBytes  94.1 Mbits/sec                  
- - - - - - - - - - - - - - - - - - - - - - - - -
[ ID] Interval           Transfer     Bitrate
[  5]   0.00-10.04  sec   112 MBytes  93.7 Mbits/sec                  receiver
-----------------------------------------------------------
Server listening on 1921
-----------------------------------------------------------

CLIENT SIDE

iperf3 -c 10.0.0.252 -p 1921
Connecting to host 10.0.0.252, port 1921
[  5] local 10.0.0.7 port 57856 connected to 10.0.0.252 port 1921
[ ID] Interval           Transfer     Bitrate         Retr  Cwnd
[  5]   0.00-1.00   sec  11.7 MBytes  98.2 Mbits/sec    0   99.7 KBytes       
[  5]   1.00-2.00   sec  11.2 MBytes  94.0 Mbits/sec    0   99.7 KBytes       
[  5]   2.00-3.00   sec  11.2 MBytes  94.0 Mbits/sec    0   99.7 KBytes       
[  5]   3.00-4.00   sec  11.2 MBytes  94.0 Mbits/sec    0   99.7 KBytes       
[  5]   4.00-5.00   sec  11.3 MBytes  94.4 Mbits/sec    0   99.7 KBytes       
[  5]   5.00-6.00   sec  11.4 MBytes  95.4 Mbits/sec    0    143 KBytes       
[  5]   6.00-7.00   sec  11.3 MBytes  94.8 Mbits/sec    0    143 KBytes       
[  5]   7.00-8.00   sec  11.0 MBytes  92.3 Mbits/sec    0    143 KBytes       
[  5]   8.00-9.00   sec  11.3 MBytes  94.8 Mbits/sec    0    143 KBytes       
[  5]   9.00-10.00  sec  11.3 MBytes  94.8 Mbits/sec    0    143 KBytes       
- - - - - - - - - - - - - - - - - - - - - - - - -
[ ID] Interval           Transfer     Bitrate         Retr
[  5]   0.00-10.00  sec   113 MBytes  94.7 Mbits/sec    0             sender
[  5]   0.00-10.04  sec   112 MBytes  93.7 Mbits/sec                  receiver

iperf Done.

Test can be reversed too (do it in both ways)

If this test is ok, lets move to check the full config of your nc deploy.

iperf shows:

[  1] local 192.168.1.177 port 5123 connected with 192.168.1.218 port 56552 (icwnd/mss/irtt=14/1448/82)
[  3]  0.0-10.0 sec  1.10 GBytes   943 Mbits/sec

both ways, so that looks right I think

ok, so, network issues discarded.
NC have a lot of fine tunning. DB managment, caches, etc. I suggest you to check THIS GUIDES to improve response times. Your hardware is enought to run NC with a great performance.
I have it running in VM with very limited resources and works really fine (the most demandant issue is disk access, the rest is average in demand)
To diagnose the whole system, you need to check logs of every component (some suggestions) (php (8.0, fpm model w/a fine tunned pool), mariadb, webserver(nginx), cache (APCu to local, Redis to distributed and locking,etc etc)
PHP configuration is the most relevant part to achieve a good performance. And caches can be problematic if they are not well configured.