Files component is very slow - How to debug the situation?

So i have a nextcloud instance, self hosted, and everything is great.

There is one small issue i have lately and is the fact the the Files component is very slow. So every other component works fine (fast) (deck, notes, etc).

The server is running on a ubuntu 22.04 container, with apache, and mariadb 10.3. Also i using php 8.2 with opcache enabled.

So the thing is that when i first click the files icon, it start to load, and waits for about 10-20 seconds before showing the main interface, with a spining animation at the center. It then waits another 10-15 seconds before all the files show up. After that i can click on a folder and it opens it very fast (1 second maybe).
So what could it be ? Could it be that it build the whole folder structure everytime ? Maybe one of my plugins is to blame ? (Group Folders for example).

I tried everything i found related to tuning, but i think its not actually related to tuning mysql or php.

So what im asking is how could i approach this in order to find out what is actually causing this.
Im thinking maybe something like this:

  • clone the instance
  • start deleting apps
  • remove all the folder shares
  • remove folders

What else ? What do you think ?

start from the OS and dig down deeper into individual components.
have a look what the CPU/Memory/IO is doing (htop/atop)
if it is mysql (possibly), you will see spikes in CPU/mem utilization and/or IO waits.

For mysql, the mysqltuner.pl script was gold to help navigating to optimize innodb and all the buffers.

Having mysqldb on a fast nvme drive made quite a difference too.

Enabling memcache in Nextcloud (APCu/Redis) was another step forward.

Tuning PHP-FPM was another area that improved things massively (OPcache etc).

Same as having database on fast nvme, this is true for the Nextcloud data dir location too.

Splitting workloads on and run them on separate machines (ie. Nextcloud core on one worker/node, Collabora CODE on another worker/node, run database on another worker/node also made difference).

So in nuthsell, I’d start with undestading what’s going on on the system level and follow on from there.

1 Like
  • Check browser console/inspect (Console and Network tabs are typically of the most interest)
  • Check your Nextcloud log

Wild guess: Do you have some old External Storage mounts configured that aren’t working any longer?

1 Like

Hy there.
So i have used mysqltuner.pl, im using ssds, i have memcache and redis, also opcache for php.

So, after some digging it seems that everything goes sideways if i have the File sharing app enabled.

Everything is very fast if it is disabled (related to the files component).

If i enable it, i get the mentioned behaviour.

Ive checked the access logs, and everything seems fine.
I also checked the process list in mysql, and everything is running very fast.

On client side i can see this if i hit F5 on the Files app.
So this is from the network tab in the browser:


Any ideas related to the File Sharing app ? What to look for ? Could it still be related to stuff like the database ?

edit: i think its the same issue described here Slow loading files page on federated shares - :information_source: Support - Nextcloud community

Bump.
So does anyone have any ideea how i could debug whats happening with that file sharing app ?

Please post the output of occ config:list system.

This is it:

{
    "system": {
        "debug": true,
        "log_type": "file",
        "loglevel": 2,
        "logfile": "\/var\/log\/nextcloud.log",
        "overwriteprotocol": "https",
        "instanceid": "***REMOVED SENSITIVE VALUE***",
        "passwordsalt": "***REMOVED SENSITIVE VALUE***",
        "secret": "***REMOVED SENSITIVE VALUE***",
        "trusted_domains": [
            "cloud.sni.ro"
        ],
        "datadirectory": "***REMOVED SENSITIVE VALUE***",
        "dbtype": "mysql",
        "version": "28.0.1.1",
        "overwrite.cli.url": "https:\/\/xxxxxx\/nextcloud",
        "dbname": "***REMOVED SENSITIVE VALUE***",
        "dbhost": "***REMOVED SENSITIVE VALUE***",
        "dbport": "",
        "dbtableprefix": "oc_",
        "mysql.utf8mb4": true,
        "dbuser": "***REMOVED SENSITIVE VALUE***",
        "dbpassword": "***REMOVED SENSITIVE VALUE***",
        "installed": true,
        "mail_from_address": "***REMOVED SENSITIVE VALUE***",
        "mail_smtpmode": "smtp",
        "mail_sendmailmode": "smtp",
        "mail_domain": "***REMOVED SENSITIVE VALUE***",
        "mail_smtpauthtype": "LOGIN",
        "mail_smtpauth": 1,
        "mail_smtphost": "***REMOVED SENSITIVE VALUE***",
        "mail_smtpport": "587",
        "mail_smtpname": "***REMOVED SENSITIVE VALUE***",
        "mail_smtppassword": "***REMOVED SENSITIVE VALUE***",
        "mail_smtpsecure": "tls",
        "memcache.local": "\\OC\\Memcache\\APCu",
        "default_phone_region": "40",
        "has_rebuilt_cache": true,
        "maintenance": false,
        "enable_previews": true,
        "enabledPreviewProviders": [
            "OC\\Preview\\Image",
            "OC\\Preview\\Movie",
            "OC\\Preview\\TXT"
        ],
        "theme": "",
        "logdateformat": "F d, Y H:i:s",
        "memcache.distributed": "\\OC\\Memcache\\Redis",
        "memcache.locking": "\\OC\\Memcache\\Redis",
        "redis": {
            "host": "***REMOVED SENSITIVE VALUE***",
            "port": 6379
        },
        "app_install_overwrite": [
            "drawio"
        ]
    }
}

“debug”: true,

Set debug to false. Wait a few moments or restart your app container. At least part of your problems will likely go away. Debug mode changes how the front-end behaves. Performance will be heavily impacted.[1][2]

Also:

 “version”: “28.0.1.1”,

You’re way behind on maintenance releases. Please upgrade to 28.0.8 or 28.0.7 before troubleshooting further.[3]

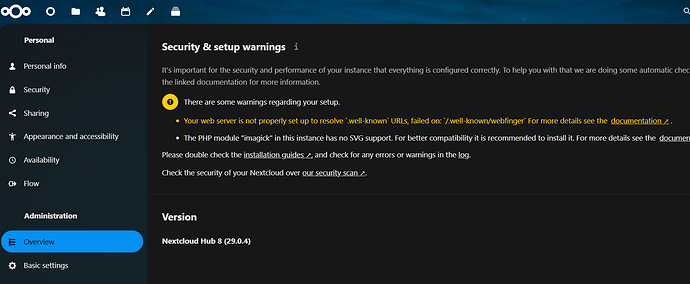
Lastly, check Administration settings->Overview and correct any warnings/errors that appear there. (Incidentally, there is a warning that you’ll get if debug is on, in part for this reason). :wink:

[1] Configuration Parameters — Nextcloud latest Administration Manual latest documentation
[2] Server tuning — Nextcloud latest Administration Manual latest documentation
[3] Maintenance and release schedule — Nextcloud latest Administration Manual latest documentation

1 Like

The debug=true is set because im trying to debug the problems. Ive just enabled it.
The problem i have is with the file sharing app. If i enable it it takes 10-20 seconds to load the files section.

Okay well it’ll impact performance. :slight_smile:

Either way, rather than have us waste time debugging an unsupported version, please bump to a current maintenance release[1].

And also check Admin->Overview for us.

[1] Nextcloud server changelog

Sorry. I misspoke in the last reply. So with debug=false, it takes about 20 seconds to load the files app.
If i disable the files app it will load it in 2-3 seconds.
I will upgrade to the last version right now.
PS: im doing this on a clone of the production instance. So there is nobody else using it.

So just did the upgrade.

Still behaves the same way.

So do you have any pointers as to how i should go about it ?

Like i mentioned before, this is a isolated enviroment so nobody else is using it.

Its on ssds, it has RAM, it has cpu cores.

The only thing i found is that its very slow when activating the file sharing app.

Also worth mentioning, i do have a couple of users that have a a lot of folders shared. (maybe 10-20 folders, but a lot of subfolders in them).

Shared from or to them from elsewhere? The two things that come to mind are: anything External Storage or Federated Share related. For the former it would usually be old no longer in-use Personal or Admin External Storage mounts. For the latter, I suppose it could be either broken shares or really slow ones.

For federated shares, you might try setting the timeout really low (so they timeout fast). Not a permanent solution, but just to see if anything changes: Configuring Federation Sharing — Nextcloud latest Administration Manual latest documentation

P.S. During these tests are you monitoring your Nextcloud log (nextcloud.log) in addition to your web server access logs?

So related to shares:

  • dont have any external shares
  • i do have folder (with many files) shared to users on the same nextcloud instance.

About the logs. Its set to /var/log/nextcloud.log.
But its not outputing anything to it.

This is from the config file:

‘log_type’ => ‘file’,
‘logfile’ => ‘/var/log/nextcloud.log’,
‘loglevel’ => 2,
‘logdateformat’ => ‘F d, Y H:i:s’,

Since you set the log to a non-default location, you’ll need to set appropriate permissions on /var/log/nextcloud.log (at a minimum) for your web user to write to that file (e.g. www-data). The default is to log to your data directory, where this would be unnecessary.

It was a typo … so its set to /var/log/nextcloud.log as u can see from the config.

I just deleted the nextcloud.log file from /var/log folder.

Its it supposed to create a new one ?

In the default location, yes. But in /var/log/ not unless you’ve given that same user write access to /var/log (which I don’t suggest).

Ok so i changed the config and only left this:

‘log_type’ => ‘file’,
‘logfile’ => ‘nextcloud.log’,
‘loglevel’ => 0,
‘logdateformat’ => ‘F d, Y H:i:s’,

So i see that the file is created at some point (not sure when), and i can see some things going in that file.

But its strange. If i tail the file i dont see anything while im navigating the platform.

All the messages look like this:

{"reqId":"h5yi5jxIBBHvmWly3e6B","level":0,"time":"August 05, 2024 13:20:19","remoteAddr":"","user":"--","app":"no app in context","method":"","url":"--","message":"dirty table reads: SELECT * FROM `*PREFIX*jobs` WHERE (`reserved_at` <= :dcValue1) AND (`last_checked` <= :dcValue2) AND (`time_sensitive` = :dcValue3) ORDER BY `last_checked` ASC LIMIT 1","userAgent":"--","version":"
{"reqId":"h5yi5jxIBBHvmWly3e6B","level":0,"time":"August 05, 2024 13:20:19","remoteAddr":"","user":"--","app":"cron","method":"","url":"--","message":"CLI cron call has selected job OC\\Log\\Rotate (id: 31, arguments: null)","userAgent":"--","version":"29.0.4.1","data":{"app":"cron"}}
{"reqId":"h5yi5jxIBBHvmWly3e6B","level":0,"time":"August 05, 2024 13:20:19","remoteAddr":"","user":"--","app":"cron","method":"","url":"--","message":"Starting job OC\\Log\\Rotate (id: 31, arguments: null)","userAgent":"--","version":"29.0.4.1","data":{"app":"cron"}}
{"reqId":"h5yi5jxIBBHvmWly3e6B","level":0,"time":"August 05, 2024 13:20:19","remoteAddr":"","user":"--","app":"cron","method":"","url":"--","message":"Finished job OC\\Log\\Rotate (id: 31, arguments: null) in 0 seconds","userAgent":"--","version":"29.0.4.1","data":{"app":"cron"}}
{"reqId":"h5yi5jxIBBHvmWly3e6B","level":0,"time":"August 05, 2024 13:20:20","remoteAddr":"","user":"--","app":"no app in context","method":"","url":"--","message":"dirty table reads: SELECT * FROM `*PREFIX*jobs` WHERE (`reserved_at` <= :dcValue1) AND (`last_checked` <= :dcValue2) AND (`time_sensitive` = :dcValue3) ORDER BY `last_checked` ASC LIMIT 1","userAgent":"--","version":"
{"reqId":"h5yi5jxIBBHvmWly3e6B","level":0,"time":"August 05, 2024 13:20:20","remoteAddr":"","user":"--","app":"cron","method":"","url":"--","message":"CLI cron call has selected job OC\\Core\\BackgroundJobs\\CleanupLoginFlowV2 (id: 1883, arguments: null)","userAgent":"--","version":"29.0.4.1","data":{"app":"cron"}}
{"reqId":"h5yi5jxIBBHvmWly3e6B","level":0,"time":"August 05, 2024 13:20:20","remoteAddr":"","user":"--","app":"no app in context","method":"","url":"--","message":"dirty table reads: SELECT * FROM `*PREFIX*jobs` WHERE (`reserved_at` <= :dcValue1) AND (`last_checked` <= :dcValue2) AND (`time_sensitive` = :dcValue3) ORDER BY `last_checked` ASC LIMIT 1","userAgent":"--","version":"

Yeah, so only logs from cron show up it seems.
I even enabled debug mode and nothing shows up when i click dashboard, or deck, or anything.

I still dont know what is happening or where to actually look.
Is there any way to delete all the shares, via occ, or something like that ?