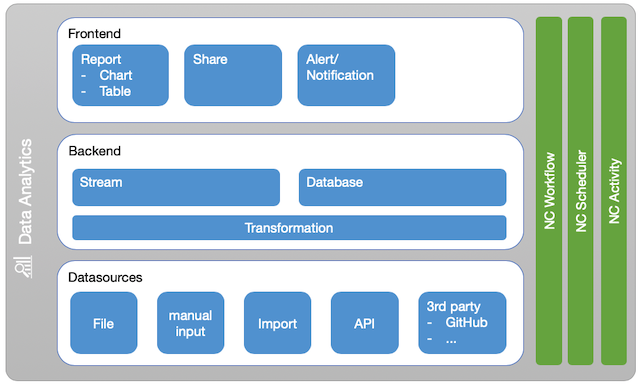
I want to present the first preview on the new Data Analytics app for Nextcloud.
The concept is based on proven ETL and data warehousing concepts and should offer an on premise alternative.
I am finishing the testing for the first release version, which is scheduled in the next weeks.
But now I would like to get your impressions!
This would make my Nextcloud instance even more useful than it is today. I am incredibly much looking forward to this. I love statistics, and I love to analyse and share data easily. This is not something I would specifically look for in the app store, but now when I know it is a reality and it will come, I am so excited to put things into it and play around.
Really awesome work so far, it looks very polished and promising!
Will there be any way to extract local nextcloud data from the database and present reports based on that?
the 2 apps have a different approach as Sensorlogger if currently targeted only for temp/hum sensor values.
Data Analytics can handle these values - but also any other value - because its a generic data model.
Data Analyitcs could theoretically also read existing sensorlogger tables, but thats not intended at the moment.
On the other side, the Sensorlogger has a bigger API which can register new sensors from external (would be similar to a “Report” in DA). This is not the scope for DA because it is based on internal ownership/customization/sharing of reports
would it be possible to have the graphics connected to the nc database where all the file information stuff is stored. So you can make charts for labeled files, shared files, downloaded files over time, … so somthing like the activities but in different chart layouts.
It is really cool!!!
Yet I have several perplexities. I’ll cite also @frank because I think that this is important, I hope not to disturb.
In the last years data analysis and visualization are having a huge development. A lot of the more important tools are open source (for example the languages R and Python or several javascript visualization libraries) ; if you want data about R and Python importance I can provide it to you.
My first reaction is that if you do not use one of the established tools you’ll provide something which is “amateurish” according to the actual standards: a reduced number of graphics options and of analysis and transformation options will be available to the users.
I am saying this especially because the target of your tool seem to be data uploaded to Nextcloud.
This would be a bit less true if the target of the tool was data “generated” by Nextcloud. I’d love to have graphics about files uploaded per month (number, dimension, type of file, users, …) or file sharing or whatever. This was never targeted in a comprehensive way: there are some tools targeted more towards the administrator than the user. I do think that having the possibility to use my metadata as an user is a terrific way of conveying the importance of my metadata!
It is clear that having the possibility of using sophisticated data analysis techniques would be even better.
I remember one example: the face recognition app was just released on the app store. That is just one of the thousands of possibilities of data analysis on my data stored in Nextcloud. Clearly some techniques could start as experiments and then require some wrappers (i.e. an easy app for most of users to install). Some others would be personal.
I hope I was not too harsh, that wasn’t my goal. I just wanted to provide useful feedback
Hello @Spartachetto
thank you for your feedback.
If the app is flexible - both will be possible.
The app idea was born from my personal usecase to share financial data; have others collect data; visualize home automation data; visualize external data like GitHub.
The aim is to have a flexible backend to cover as much as possible. When you have a usecase which I did not look at - like NC generated data - thats a valid point and the concept of additional Datasources with in the app is a fit for this.
On the roadmap there is the target to provide hook for own datasources of other devs. But NC-related tables could be in scope. I will have a look what is available and check back with the NC-Team, not to overlap with topics there.
The other interesting points are libraries that you mentioned. I don´t know where the app will develop to, but I can´t really imagine that they will be of much use here due to the complexity in the UI.
e.g. Pandas is nice - but its a standalone tool and visualizing its results within an NC-Frame might be a challenge.
The second thing is, that an NC-app is dependent on its own predefined tables in the database. You cant create new tables which are dependend on different typlologies per dataset. So this limitation of size & structures will not enable you to go Big-Data anyway.
Column store tables; Star-Schemas; Graph Strucures - all interesting points for major tools like PowerBI, SAP HANA …
I am finishing the testing of the app.
The REST API is done;
File app integration is done;
Exceptions/Threshholds/Alerts based on Notifications in progress.
I will post another video update soon.
It will be interesting to see the different usecases developing going forward
")
")
")