Hi,
I started to use Analytics for data collection of IOT device. So far it is great and really like it.
I’m using REST API to post data to Nextcloud 1x every minute.
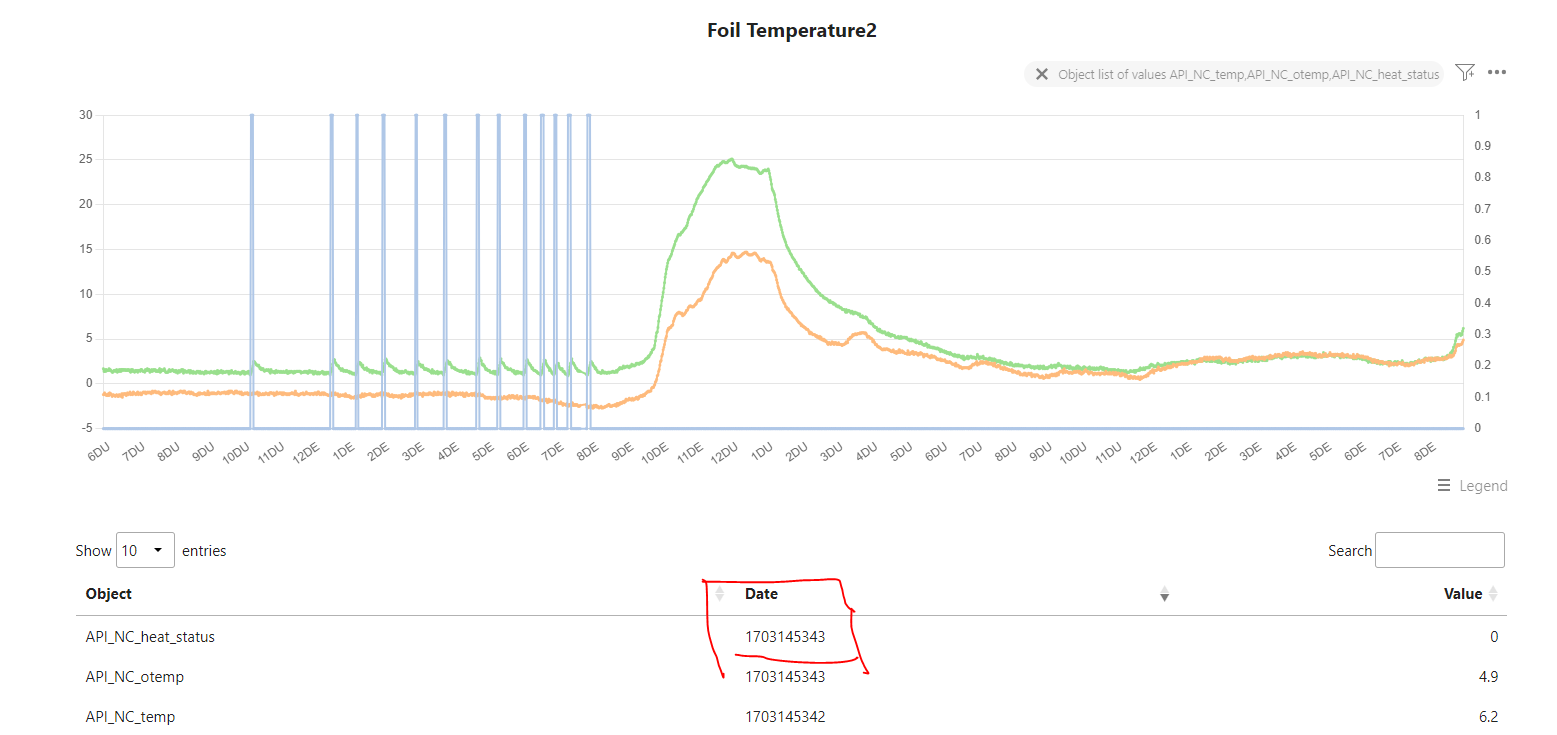
As I dont use a RTC clock on my device I use the %now% text variable function to get the Unix timestamp for Dimension2 field of the dataset. I could change the date visualization on the X Axis, but I could not figure out if there is a way to represent the date in a formatted way instead of the EPOC in the database. If I use both the %date% %time% variable in the request like a datetime format, the table looks fine, but the axis has issues with sorting increasing correctly.
I prefer keeping EPOCH in the DB as it gives better starting point to any new direction. Is there a way to format the table’s visualization?
Many thanks,
Barnabas