502 Bad Gateway from Nginx Reverse Proxy with Nextcloud AIO

The Basics

  • Nextcloud Server version (e.g., 29.x.x):
    • Nextcloud AIO v12.8.0
  • Operating system and version (e.g., Ubuntu 24.04):
    • Ubuntu 24.04.4 LTS
  • Web server and version (e.g, Apache 2.4.25):
    • Whatever is in AIO
  • Reverse proxy and version _(e.g. nginx 1.27.2)
    • nginx 1.29.1
  • PHP version (e.g, 8.3):
    • 8.3.6
  • Is this the first time you’ve seen this error? (Yes / No):
    • no
  • When did this problem seem to first start?
    • Months ago
  • Installation method (e.g. AlO, NCP, Bare Metal/Archive, etc.)
    • AIO
  • Are you using CloudfIare, mod_security, or similar? (Yes / No)
    • no

Summary of the issue you are facing:

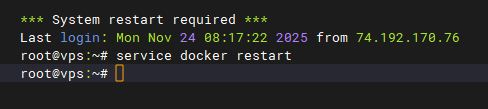
After running for an random amount of time, users start getting a 502 error when going to the NextCloud page. I have to recycle docker (service docker restart). Once docker is recycled, I have to go to the AIO containers page and Stop containers and then Start containers for NextCloud to come back and be accessible.


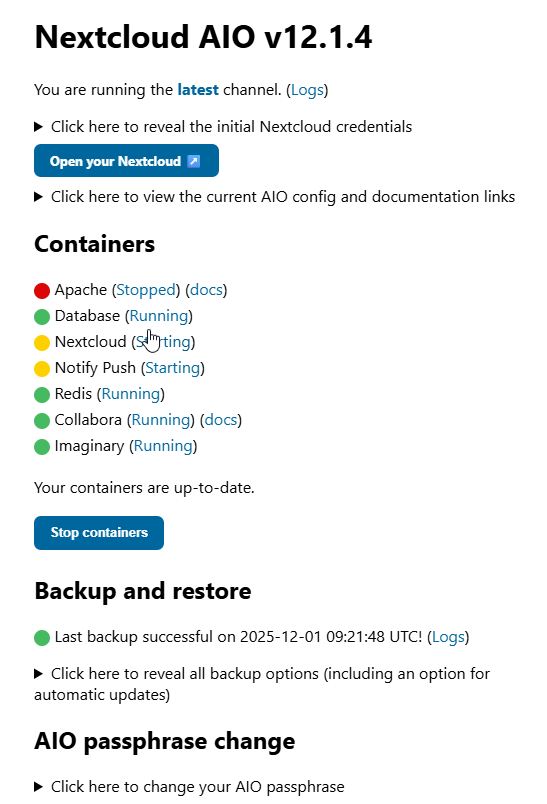
AIO and Ubuntu have both been upgraded. The issue still persists. I am unsure where/how to troubleshoot from here.

Steps to replicate it (hint: details matter!):

1. Just wait. Eventually it will fail.

Log entries

When I recycle docker I lose the logs. I need to get them next time. 

Web server / Reverse Proxy

The output of your Apache/nginx/system log in /var/log/____:

TBD

Configuration

Nextcloud

The output of occ config:list system or similar is best, but, if not possible, the contents of your config.php file from /path/to/nextcloud is fine (make sure to remove any identifiable information!):

PASTE HERE

Apps


* activity: 5.0.0
* admin_audit: 1.22.0
* bruteforcesettings: 5.0.0
* cloud_federation_api: 1.16.0
* comments: 1.22.0
* dav: 1.34.2
* federatedfilesharing: 1.22.0
* files: 2.4.0
* files_automatedtagging: 3.0.3
* files_downloadlimit: 5.0.0-dev.0
* files_pdfviewer: 5.0.0
* files_reminders: 1.5.0
* files_sharing: 1.24.1
* files_trashbin: 1.22.0
* files_versions: 1.25.0
* flow_notifications: 3.0.0
* logreader: 5.0.0
* lookup_server_connector: 1.20.0
* nextcloud-aio: 0.8.0
* nextcloud_announcements: 4.0.0
* notifications: 5.0.0
* notify_push: 1.3.1
* oauth2: 1.20.0
* password_policy: 4.0.0
* privacy: 4.0.0
* profile: 1.1.0
* provisioning_api: 1.22.0
* recommendations: 5.0.0
* related_resources: 3.0.0
* richdocuments: 9.0.5
* serverinfo: 4.0.0
* settings: 1.15.1
* support: 4.0.0
* survey_client: 4.0.0
* systemtags: 1.22.0
* text: 6.0.1
* theming: 2.7.0
* twofactor_backupcodes: 1.21.0
* updatenotification: 1.22.0
* user_status: 1.12.0
* viewer: 5.0.0
* webhook_listeners: 1.3.0
* workflowengine: 2.14.0
  
Disabled:
* app_api: 32.0.0 (installed 32.0.0)
* calendar: 6.2.1 (installed 6.2.1)
* cfg_share_links: 7.0.1 (installed 7.0.1)
* circles: 32.0.0 (installed 32.0.0)
* contacts: 8.3.6 (installed 8.3.6)
* contactsinteraction: 1.13.1 (installed 1.13.1)
* dashboard: 7.12.0 (installed 7.12.0)
* deck: 1.16.3 (installed 1.16.3)
* encryption: 2.20.0
* federation: 1.22.0 (installed 1.22.0)
* files_external: 1.24.1
* firstrunwizard: 5.0.0 (installed 5.0.0-dev.0)
* notes: 4.13.1 (installed 4.13.1)
* photos: 5.0.0 (installed 5.0.0-dev.1)
* sharebymail: 1.22.0 (installed 1.22.0)
* suspicious_login: 10.0.0
* tasks: 0.17.1 (installed 0.17.1)
* twofactor_nextcloud_notification: 6.0.0
* twofactor_totp: 14.0.0 (installed 14.0.0)
* user_ldap: 1.23.0
* weather_status: 1.12.0 (installed 1.12.0)

Until you get logs next time, we’d all be guessing as to the cause. So I guess wait until it occurs again then report back.

Here is the log file. Crash at the beginning and then again at the end of it. I redacted the site name for security reasons.

Here is the raw log: NextCloud 502 Errors

Logs have been added. Thank you.

Hey Dan,

I had a look at your log file. A few things stand out.

All the errors come from the richdocuments app, and they repeat in the same pattern across multiple days:

  • March 30, 14:06 UTC — Failed to fetch capabilities and Failed to fetch discovery, both 502
  • April 1, 09:09 UTC — same pair of errors
  • April 5, 09:49 UTC — same again

So whatever is happening, it’s recurring every few days.

There are also around 50 entries like:

Failed to convert preview: cURL error 28: 
  Operation timed out after 5002 milliseconds with 0 bytes received
  for http://nextcloud-aio-apache:23973/cool/convert-to/png

That one is a timeout on an internal request — 5 seconds, 0 bytes received. So at that point, the Collabora process wasn’t responding at all anymore.

Looking more closely at the timeout entries, it’s not just one or two isolated incidents – it’s a constant barrage of attempts over several days, from many different users (different IPs and user agents), all accessing documents via public share links and failing at the same point every time: preview generation via Collabora. This leads me to suspect that the Collabora process isn’t just briefly stalling and then recovering, but is completely down for days on end or it is because of a bug inside of collabora, which makes this request time out if it is configured to not create previews.

Now, I don’t know your setup in detail, but the pattern — works fine for a while, then stops responding, needs a full service docker restart to recover — makes me think this could be a resource issue on the VPS, specifically RAM.

Collabora/CODE can use a good amount of memory, and depending on how many documents get opened or previewed, that usage can grow over time. If the VPS runs low on memory, the Linux OOM killer might terminate processes inside containers, or the system starts swapping heavily and everything becomes too slow to respond within the timeout window. Either way, the result would look like what you’re seeing: the container appears to be running, but the process inside isn’t answering anymore.

The fact that you need a full docker restart (not just restarting the containers through AIO) would also fit — if the system was under heavy memory pressure, Docker itself can get into a bad state.

I could be wrong on this, but it would be easy to verify. Could you check:

  • free -h — to see how much RAM you have and what’s currently available
  • dmesg | grep -i "oom\|killed" — this would show if the OOM killer has been active

If you can’t add more RAM to the VPS right now, it would at least help to log memory usage over time so you have data when the next crash happens. A simple cron job like this would do:

*/5 * * * * echo "$(date): $(LC_MESSAGES=C free -m | grep Mem)" >> /var/log/memwatch.log

And for per-container memory:

*/5 * * * * docker stats --no-stream --format "$(date): {{.Name}} {{.MemUsage}}" >> /var/log/docker-memwatch.log

These logs are written to the host filesystem, so unlike the Nextcloud logs they’ll survive a docker restart. That way you’d be able to look at what was happening in the minutes leading up to the crash and confirm (or rule out) the memory theory.

Also worth checking after the next crash: journalctl -k or /var/log/syslog — OOM events get logged there. Or use this one: dmesg | grep -i "oom\|killed"

One more small thing: your terminal output shows *** System restart required *** — that typically means a kernel update has been installed and the system needs a reboot to run the new kernel. Probably unrelated to this issue, but worth doing when you get a maintenance window.

h.t.h.


ernolf

First, thank you for the information. To answer an unasked question: Yes this is a public server and there are a lot of Word/Excel/PDF documents on it. This server hosts resources for courses and the various majors at a university. So, anonymous access. And, we cannot (well, shouldn’t) block internal IPs via geoip since we do have students/alumni all over the world. That said, we might be able to reduce bot crawling and that might help the pressure on the server. I am open to suggestions here.

The last reset of docker (for this issue) was done approximately 40 hours ago. Giving context for memory usage. You were correct in assuming I would not be able to add RAM to this server.

               total        used        free      shared  buff/cache   available
Mem:            15Gi       4.2Gi       328Mi       369Mi        11Gi        11Gi
Swap:          511Mi       511Mi        84Ki

Current docker usage:

Wed Apr 15 08:32:36 EDT 2026: nextcloud-aio-apache 77.34MiB / 15.52GiB
Wed Apr 15 08:32:36 EDT 2026: nextcloud-aio-nextcloud 109.6MiB / 15.52GiB
Wed Apr 15 08:32:36 EDT 2026: nextcloud-aio-imaginary 15.92MiB / 15.52GiB
Wed Apr 15 08:32:36 EDT 2026: nextcloud-aio-redis 5.617MiB / 15.52GiB
Wed Apr 15 08:32:36 EDT 2026: nextcloud-aio-database 219.7MiB / 15.52GiB
Wed Apr 15 08:32:36 EDT 2026: nextcloud-aio-notify-push 9.223MiB / 15.52GiB
Wed Apr 15 08:32:36 EDT 2026: nextcloud-aio-collabora 1.049GiB / 15.52GiB
Wed Apr 15 08:32:36 EDT 2026: nextcloud-aio-mastercontainer 89.96MiB / 15.52GiB
Wed Apr 15 08:32:36 EDT 2026: maintainerr 167.3MiB / 15.52GiB

For the dmesg, there is no output at all.

root@vps:~# dmesg | grep -i "oom\|killed"
root@vps:~# 

There are, however, a LOT of messages about eth0 blocking if I remove grep. I am looking at fail2ban now to see if it is doing this.

[2120844.333119] br-986731db7277: port 6(veth63c992b) entered blocking state
[2120844.333129] br-986731db7277: port 6(veth63c992b) entered forwarding state
[2120844.919214] br-986731db7277: port 7(vethf1edaa7) entered blocking state
[2120844.919226] br-986731db7277: port 7(vethf1edaa7) entered disabled state
[2120844.919257] vethf1edaa7: entered allmulticast mode
[2120844.919369] vethf1edaa7: entered promiscuous mode
[2120844.944105] eth0: renamed from veth5cba06c

I will go down that path and setup the cron for memory usage logging.

Additionally, I upgraded everything and rebooted this morning. I re-check free and docker to see what the baseline is after a reboot.

root@vps:~# docker stats --no-stream --format "$(date): {{.Name}} {{.MemUsage}}"
Thu Apr 16 10:14:58 EDT 2026: nextcloud-aio-apache 116.3MiB / 15.52GiB
Thu Apr 16 10:14:58 EDT 2026: nextcloud-aio-nextcloud 185.8MiB / 15.52GiB
Thu Apr 16 10:14:58 EDT 2026: nextcloud-aio-imaginary 46.05MiB / 15.52GiB
Thu Apr 16 10:14:58 EDT 2026: nextcloud-aio-redis 22.25MiB / 15.52GiB
Thu Apr 16 10:14:58 EDT 2026: nextcloud-aio-database 244.8MiB / 15.52GiB
Thu Apr 16 10:14:58 EDT 2026: nextcloud-aio-notify-push 15.77MiB / 15.52GiB
Thu Apr 16 10:14:58 EDT 2026: nextcloud-aio-collabora 947.9MiB / 15.52GiB
Thu Apr 16 10:14:58 EDT 2026: nextcloud-aio-mastercontainer 157.2MiB / 15.52GiB
Thu Apr 16 10:14:58 EDT 2026: maintainerr 215.6MiB / 15.52GiB
root@vps:~# free -h
               total        used        free      shared  buff/cache   available
Mem:            15Gi       3.1Gi       7.2Gi       350Mi       5.9Gi        12Gi
Swap:          511Mi          0B       511Mi
root@vps:~# uptime
 10:15:52 up 24 min,  5 users,  load average: 0.53, 0.45, 0.43

I checked yesterday evening and then again this morning to get a picture of memory usage and fluctuation over time. I probably won’t update again until the next crash. Mostly doing this for completeness.

root@vps:/etc/fail2ban# free -h
               total        used        free      shared  buff/cache   available
Mem:            15Gi       3.6Gi       191Mi       359Mi        12Gi        11Gi
Swap:          511Mi       511Mi       136Ki
root@vps:/etc/fail2ban# docker stats --no-stream --format "$(date): {{.Name}} {{.MemUsage}}"
Thu Apr 16 22:57:50 EDT 2026: nextcloud-aio-apache 68.34MiB / 15.52GiB
Thu Apr 16 22:57:50 EDT 2026: nextcloud-aio-nextcloud 101.5MiB / 15.52GiB
Thu Apr 16 22:57:50 EDT 2026: nextcloud-aio-imaginary 11.93MiB / 15.52GiB
Thu Apr 16 22:57:50 EDT 2026: nextcloud-aio-redis 6.863MiB / 15.52GiB
Thu Apr 16 22:57:50 EDT 2026: nextcloud-aio-database 232.2MiB / 15.52GiB
Thu Apr 16 22:57:50 EDT 2026: nextcloud-aio-notify-push 3.082MiB / 15.52GiB
Thu Apr 16 22:57:50 EDT 2026: nextcloud-aio-collabora 632.3MiB / 15.52GiB
Thu Apr 16 22:57:50 EDT 2026: nextcloud-aio-mastercontainer 66.97MiB / 15.52GiB
Thu Apr 16 22:57:50 EDT 2026: maintainerr 129.9MiB / 15.52GiB
root@vps:/etc/fail2ban# free -h
               total        used        free      shared  buff/cache   available
Mem:            15Gi       3.4Gi       257Mi       349Mi        12Gi        12Gi
Swap:          511Mi       511Mi        56Ki
root@vps:/etc/fail2ban# docker stats --no-stream --format "$(date): {{.Name}} {{.MemUsage}}"
Fri Apr 17 10:52:51 EDT 2026: nextcloud-aio-apache 55.1MiB / 15.52GiB
Fri Apr 17 10:52:51 EDT 2026: nextcloud-aio-nextcloud 287.6MiB / 15.52GiB
Fri Apr 17 10:52:51 EDT 2026: nextcloud-aio-imaginary 13.04MiB / 15.52GiB
Fri Apr 17 10:52:51 EDT 2026: nextcloud-aio-redis 7.125MiB / 15.52GiB
Fri Apr 17 10:52:51 EDT 2026: nextcloud-aio-database 230.6MiB / 15.52GiB
Fri Apr 17 10:52:51 EDT 2026: nextcloud-aio-notify-push 3.117MiB / 15.52GiB
Fri Apr 17 10:52:51 EDT 2026: nextcloud-aio-collabora 894.8MiB / 15.52GiB
Fri Apr 17 10:52:51 EDT 2026: nextcloud-aio-mastercontainer 58.88MiB / 15.52GiB
Fri Apr 17 10:52:51 EDT 2026: maintainerr 121.8MiB / 15.52GiB

Ok, I finally had a crash again. I wasn’t continuously grabbing memory, but these are the memory states after the crash, but before restarting docker. I am thinking a memory leak isn’t the issue, but happy to continue down this investigative path if everyone else thinks I should.

root@vps:~# free -h
               total        used        free      shared  buff/cache   available
Mem:            15Gi       3.0Gi       175Mi       272Mi        12Gi        12Gi
Swap:          511Mi       494Mi        17Mi
root@vps:~# docker stats --no-stream --format "$(date): {{.Name}} {{.MemUsage}}"
Mon Apr 20 08:28:47 EDT 2026: nextcloud-aio-nextcloud 18.43MiB / 15.52GiB
Mon Apr 20 08:28:47 EDT 2026: nextcloud-aio-imaginary 15.12MiB / 15.52GiB
Mon Apr 20 08:28:47 EDT 2026: nextcloud-aio-redis 14.26MiB / 15.52GiB
Mon Apr 20 08:28:47 EDT 2026: nextcloud-aio-database 205.3MiB / 15.52GiB
Mon Apr 20 08:28:47 EDT 2026: nextcloud-aio-notify-push 2.34MiB / 15.52GiB
Mon Apr 20 08:28:47 EDT 2026: nextcloud-aio-collabora 763.4MiB / 15.52GiB
Mon Apr 20 08:28:47 EDT 2026: nextcloud-aio-mastercontainer 88.92MiB / 15.52GiB
Mon Apr 20 08:28:47 EDT 2026: maintainerr 133.1MiB / 15.52GiB

One further thing I forgot to include is that when I do service docker restart and then go in to the AIO Containers page, several are in a stopped/bad state. Hence why I have to stop all the containers and then start them again.

There is a screenshot in the first post, but without context. This screenshot is from this morning after restarting the docker service post-crash.

Just to add, I’m experiencing the same issue, but with a bare metal installation of Nextcloud and without reverse proxy, but with nginx. Started happening (I think) after the last Nextcloud update. Not at home at the moment, but happy to share logs later today.

I do have Collabora and Imaginary Docker containers running as well, everything else that’s Nextcloud related is running bare metal.

  1. Stop all containers from Nextcloud AIO Admin menu
  2. Remove all stopped containers - exclude mastercontainer
  3. CLI; docker compose down
  4. CLI: docker compose up -d
  5. Start all containers from Nextcloud AIO Admin menu