I have an import script to create a few users via Nextcloud’s User Provisioning API. For some reason, the performance is degrading badly.
A few runs of my script (it is still in development) back, it ran “okay” with a response time of about half a second per request. Nothing to write home about, but also not bad enough to really look into it. Recent runs of that script require 13 seconds per Request. And I need a few hundred requests to set everything up.
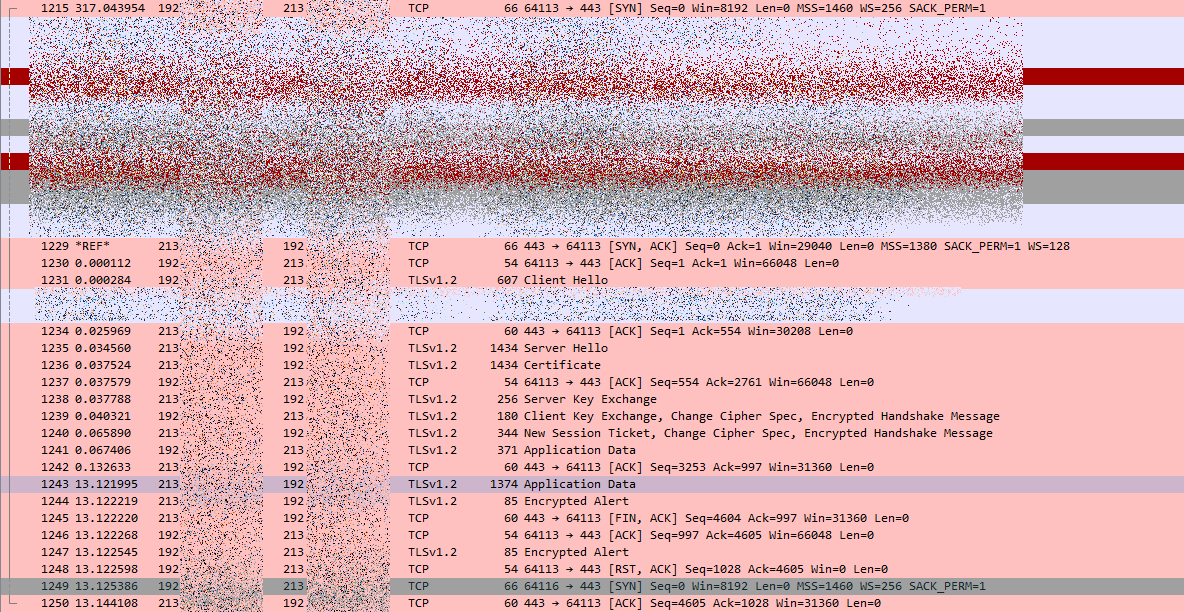
I have confirmed that my script itself is not he source of the issue. I enhanced my Apache Logfile to also print %D - the request time in microseconds. The requests really does take about 13 seconds. What irritates me is, that every request takes 13 seconds or slightly longer - almost as if there was some kind of rate-limiting in place.
Here’s a short excerpt from my script output:
  - (13105ms) request /ocs/v1.php/cloud/users/some.name (this is the POST that creates this user)
  - (13278ms) request /ocs/v1.php/cloud/users/some.name {"key":"email","value":"name.changed@example.com"}
  - (13371ms) request /ocs/v1.php/cloud/users/some.name {"key":"quota","value":"10GB"}
  - (13387ms) request /ocs/v1.php/cloud/users/some.name {"key":"display","value":"Name Changed"}
And the corresponding lines in the apache logfile (could also be from another iteration of the script. Anyway.):
x.x.x.x - admin [03/Oct/2016:23:23:01 +0200] "PUT /ocs/v1.php/cloud/users/xxx HTTP/1.1" 200 13/13244011 2358 "-" "-"
x.x.x.x - admin [03/Oct/2016:23:23:01 +0200] "PUT /ocs/v1.php/cloud/users/xxx HTTP/1.1" 200 13/13273034 2494 "-" "-"
x.x.x.x - admin [03/Oct/2016:23:23:01 +0200] "PUT /ocs/v1.php/cloud/users/xxx HTTP/1.1" 200 13/13292479 2500 "-" "-"
                                                                          time in seconds --^ /    ^--- time in microseconds
So these four requests to set up a user take almost a minute.
I run Nextcloud 10.0.0 on an Ubuntu 16.04 machine (a VM with enough resources for the job), MariaDB as database and redis as cache is configured. The web interface is plenty responsive. I do not think that this is a general performance Issue.
what I tried so far
- I added the debug output to my script and then to the apache logfile.
- CPU is idling at near-zero percent most of the time.
- Sysload is about 0.4 - not ideal, but I guess that’s due to the fact that there’s always a HTTP-Request waiting for a response.
- The Nextcloud admin interface shows no errors in server settings
- The Nextcloud.log has almost no lines in it. There’s a few
405 The resource you tried to create already exists, but I do not believe that they would be responsible for the general performance issue.
I am certain that the time is spent on the webserver. I just don’t know how to track it down further.