Hello, in my company, the graphical question is very “requested”, in questions of tasks, I would like to know if there is an option to add the graph “pizza” speaking in a more popular language, thankful now.
Hello and welcome to the Nextcloud community support forum!
Unfortunately i did not quite understand whar exactly you are looking for - Can you maybe visualize your need? If you are not a native english speaker, i’d recommend you to translate your question with deepl.com - or just write it in your native language (in the corresponding category).
Regards
1 Like
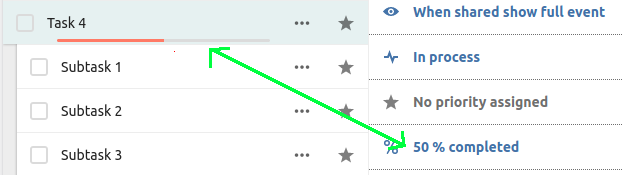
Hello, I would like, in the option to view the tasks, the option to see the progress of the tafera not only in “task lines and subtasks” , I would like to see the total percentage of the task as a graph.
It is still super hard to understand you. Please be more verbose about you request.
I guess you are talking about the Tasks app?
The percentage in the Task app can be set in the right sidebar. It will display a progress bar directly at the task. It is independent of the subtasks:
There are already two issues in the tracker to change this behavior, you should subscribe or upvote them if you are interested:
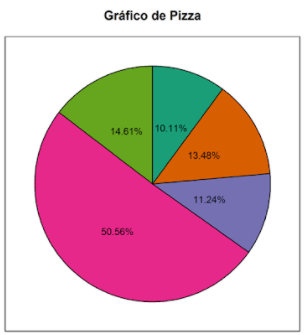
I talk about these tasks, but I would like to see this percentage in graphics like this:
In this case you should create a new issue with your feature request, so the developers are aware of your wish and can discuss whether or not this will be implemented.
I thought it already existed, thank you very much for the help.